Some system design questions sound small and turn out to be huge. “A third party sends us data; put it on a dashboard” is one of them. There’s no ride to follow and no fancy product. There’s a vendor you don’t control, a network you don’t share, a sale that turns a trickle into a flood, and a clock that says under 60 seconds.
This post walks through that round from start to finish, the way a strong senior data engineer would run it: what to ask, what to calculate, what to draw, what to defend, and in what order. Every section ends with the questions interviewers actually push on, what they’re really testing, and a strong answer.
Our candidate is Nikhil again (you may remember him from One Ride, 400 Milliseconds), in the candidate’s chair at a system-design practice session with friends. One of them plays interviewer and reads out the prompt:
“We want to ingest data from a third-party application. It’s completely outside our organisation and network, and pushing data to us is the only integration they support. We need all of it, we’ll transform it, and some metrics must show up on a dashboard less than a minute after the data arrives. It has to be highly scalable and handle very high volumes and rates. Ask me whatever you need.”
The last sentence is the most important one in the prompt, and it’s the one most candidates ignore.
Table of Contents
Act I · Before drawing anything
Scene 1: Tool soup vs. questions
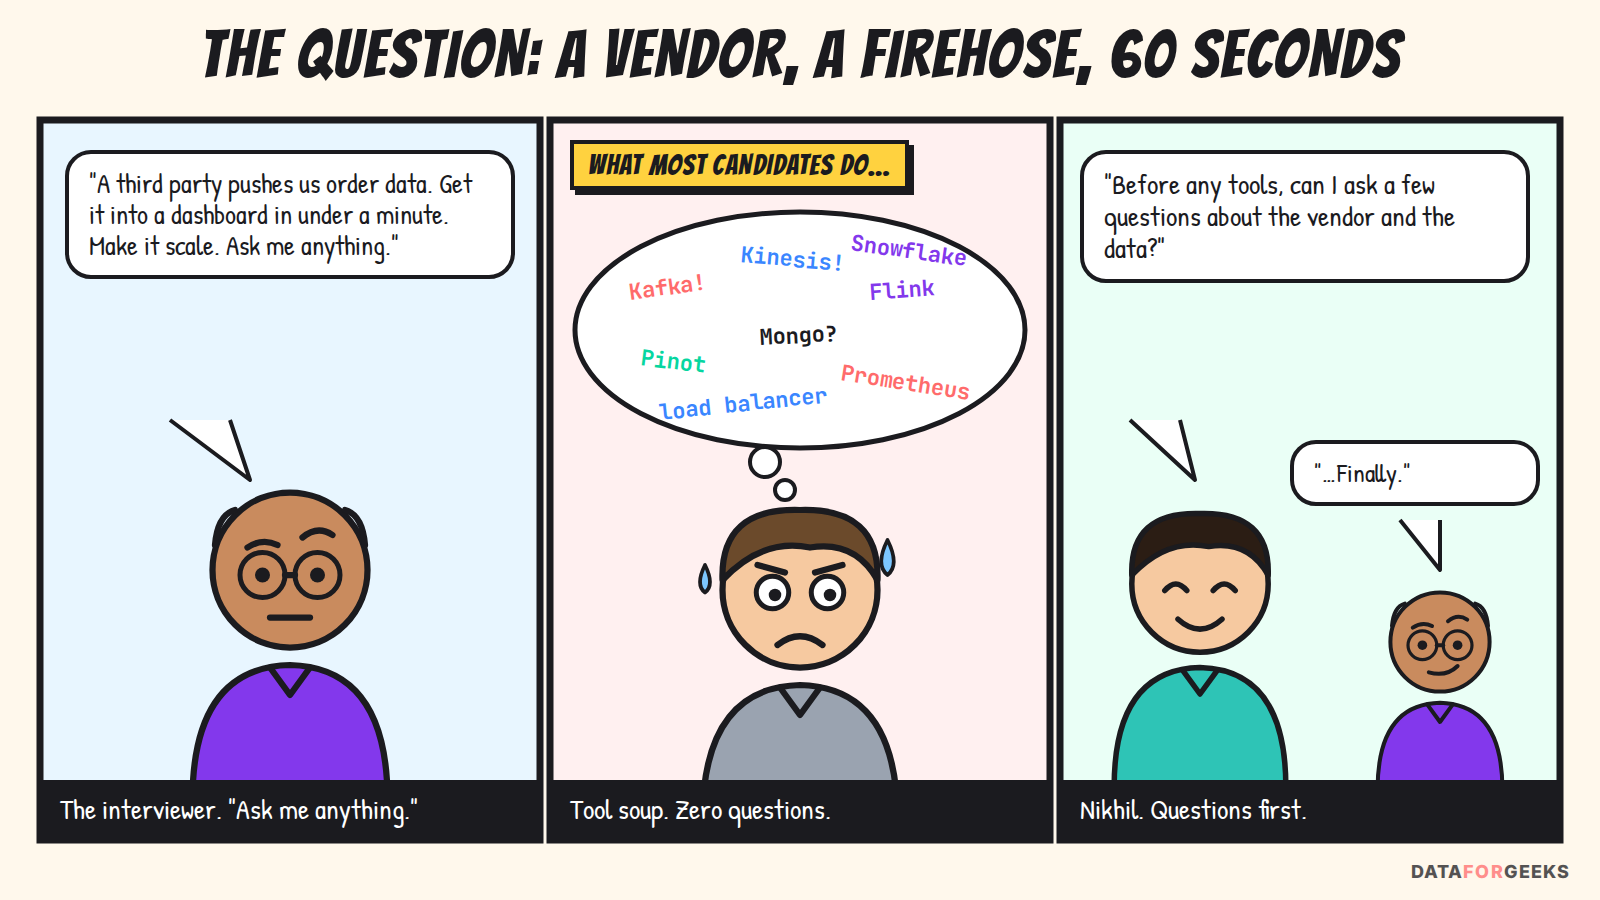
The most common failure in this round is tool soup: Kafka, Kinesis, Flink, Pinot, Snowflake, MongoDB and a load balancer, all named in the first three minutes with no reason attached to any of them. Interviewers push back quickly (“you’re bringing in a lot of technology”), and from then on the candidate is defending choices they never justified.
Nikhil does the opposite. He tells the interviewer how he’ll spend the time:
| Minutes | Step | Output on the whiteboard |
|---|---|---|
| 0–7 | Clarify requirements and constraints | A list of answered questions |
| 7–10 | Napkin math | Throughput, bytes, shards, cost: what’s feasible |
| 10–15 | End-to-end sketch | One pipeline, left to right, one reason per box |
| 15–25 | The front door | Receiving, authenticating, acknowledging, deduplicating |
| 25–33 | Scale and payload growth | Spike plan, claim-check, partitioning |
| 33–42 | The 60-second path and data model | Latency budget, serving store, tables |
| 42–50 | Day 2 | Failures, replay, observability, security, cost |
| 50–55 | Trade-offs and evolution | What he’d do next, and what he’d simplify |
Then he says the most useful sentence in any design round: “I’ll keep this simple first and add components only when a requirement forces them. Stop me wherever you want more depth.”
Scene 2: The 12 questions
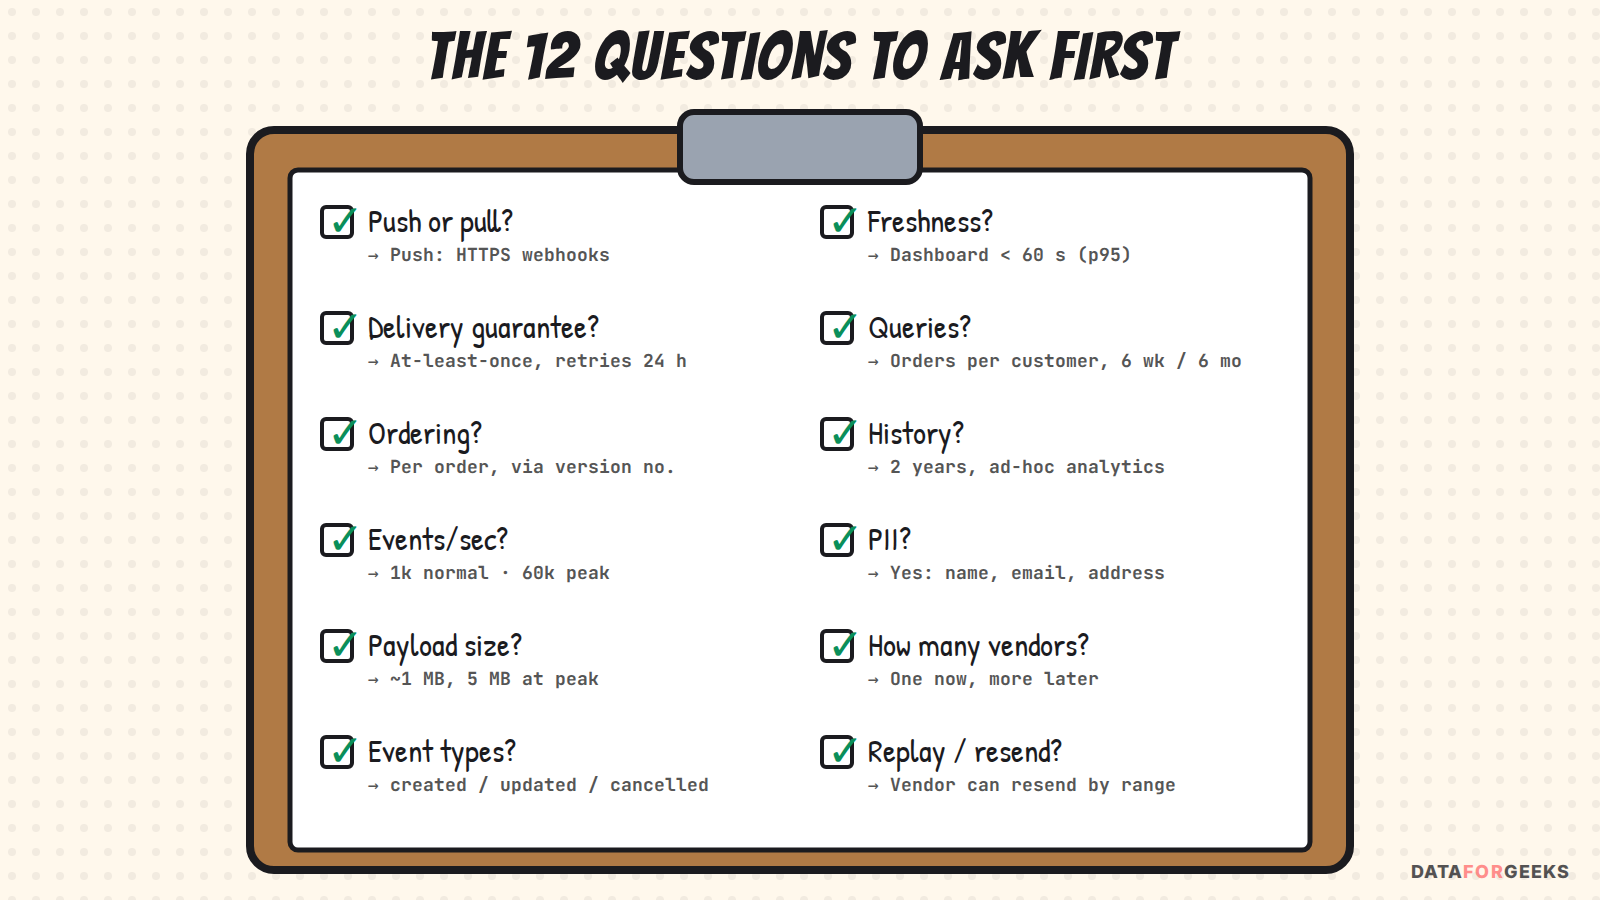
Each question exists because its answer changes the design. Here are the answers the interviewer gives, and why each one matters:
| Question | Answer | Why it changes the design |
|---|---|---|
| 1. Push or pull? | The vendor pushes HTTPS webhooks to us (the pull case is covered in Chapter 1.2) | Push means we run a public, secure, always-on endpoint. Pull means we run pollers and are limited by their API quota. Everything after ingestion stays the same. |
| 2. Delivery guarantee? | At-least-once; they retry on non-2xx for 24 h | Duplicates are guaranteed, so dedupe is mandatory. Their retry window is our outage tolerance. |
| 3. Ordering? | Not guaranteed; each event has order_id + version | We resolve order ourselves (keep highest version). |
| 4. Events per second? | ~1,000/s normal, 60,000/s during sales | A 60× spike: we need autoscaling, buffering and pre-warming. |
| 5. Payload size? | Up to ~1 MB normally, 5 MB at peak (huge baskets) | Too big to push through a stream as-is (Act III). |
| 6. Event types? | order created / updated / cancelled | We need upserts, not appends, for “current state”. |
| 7. Freshness? | Dashboard within 60 s of arrival, p95 | Streaming end to end; batch is out for this path. |
| 8. Queries? | Orders, GMV, orders per customer for 6 weeks / 6 months | Drives the serving store and data model (Act IV). |
| 9. History? | 2 years, plus ad-hoc analytics | A lakehouse/warehouse sits beside the real-time store. |
| 10. PII? | Yes: names, emails, addresses | Encryption, tokenization, access control, erasure. |
| 11. How many vendors? | One now, more planned | Build for vendor #2 without rewriting (config, not code). |
| 12. Can they resend? | Yes, by time range, on request | A recovery path for gaps. |
THE INTERVIEWER ASKS
“Why so many questions? Just design it.”
What they’re really testing: Whether you know which unknowns actually matter.
Strong answer: “Three of these answers decide the architecture: push vs pull decides whether we run a public endpoint; delivery guarantee decides whether dedupe is optional; payload size × rate decides whether full payloads can travel through a stream at all. I’ll assume sensible defaults for the rest and state them.”
Follow-up trap: “What if I refuse to answer?” Then state assumptions out loud (“I’ll assume at-least-once and no ordering, the worst case”) and design for them. Designing for the worst plausible case is safe; silently designing for the best case is not.
Scene 3: The napkin math that decides everything
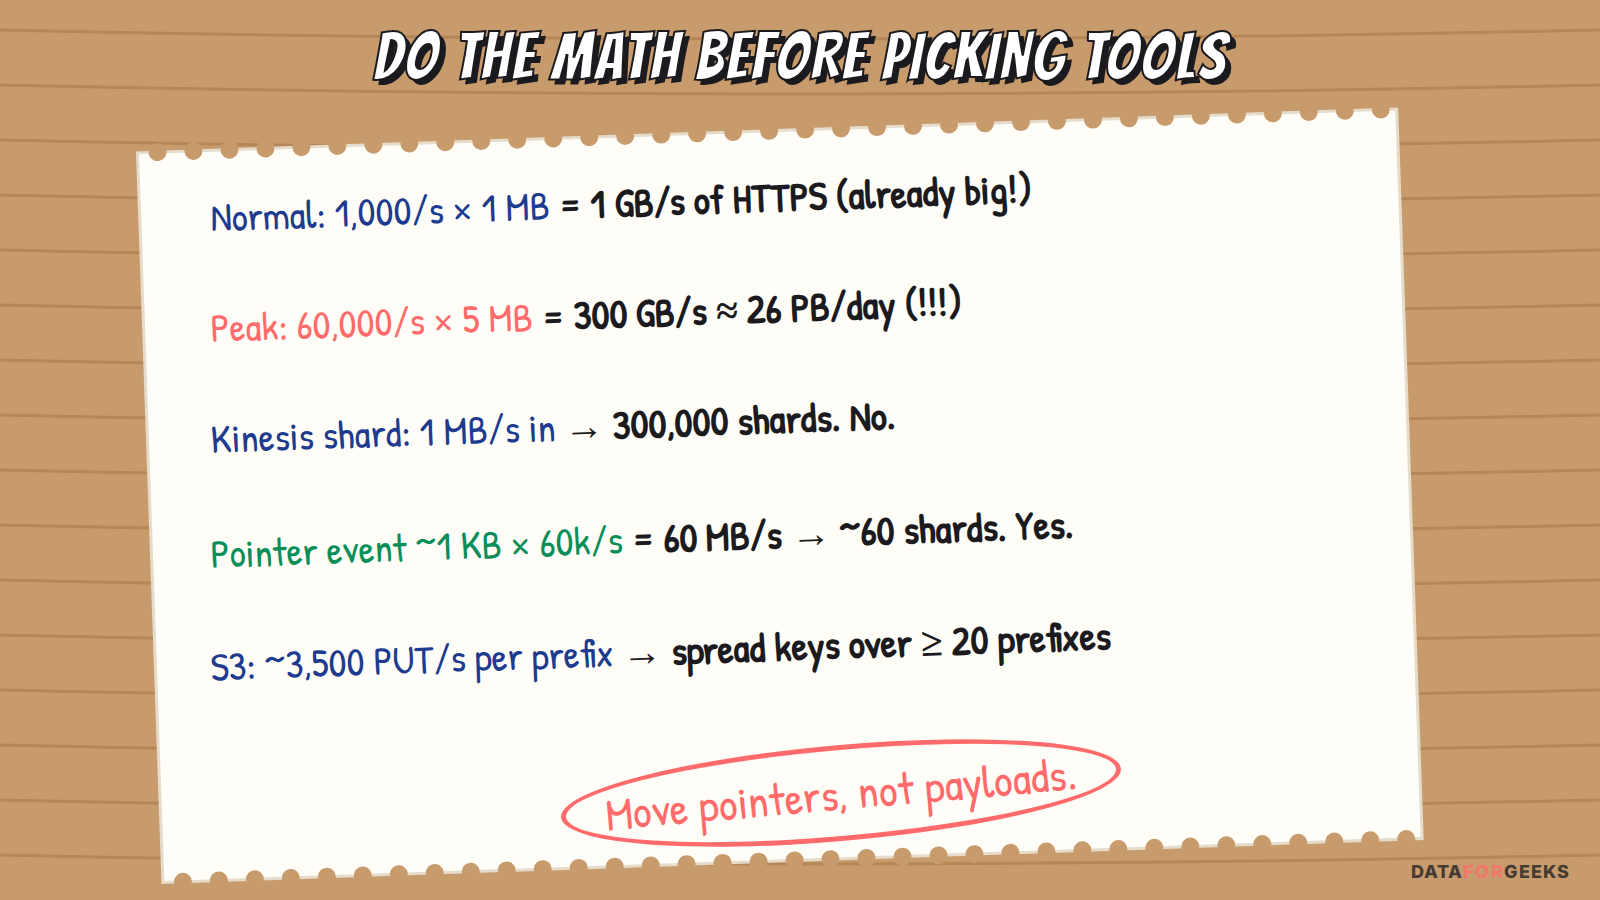
- Normal: 1,000/s × 1 MB = 1 GB/s. That’s already serious HTTPS ingress.
- Peak: 60,000/s × 5 MB = 300 GB/s, about 26 PB/day. That’s data-centre scale.
- Stream capacity: a Kinesis shard accepts ~1 MB/s (or 1,000 records/s) of writes. Full payloads would need ~300,000 shards. A Kafka partition does more, but a cluster that replicates 300 GB/s three times is not something you casually “autoscale”.
- Pointer events (~1 KB: IDs, totals, item count, S3 location): 60,000 × 1 KB = 60 MB/s. That’s ~60 shards or a modest Kafka cluster.
- Object storage: S3 supports ~3,500 PUTs/s per prefix, and it scales out as you spread keys over more prefixes. For 60,000 PUTs/s, spread keys over ≥ 20 prefixes (e.g. a hash of
event_idat the start of the key).
Nikhil also gently challenges the numbers: “Is 1 MB the typical size or the maximum? Most order events are 5–50 KB. If 1 MB is the p99, the real average might be 50 KB, and JSON compresses 5–10×.” The interviewer says: “Design for the worst case. Large baskets are common during the sale.”
That’s fine, because the math has already made the key decision: move pointers, not payloads. Big payloads go to object storage, and small events go through the stream. Every box he draws next follows from this.
THE INTERVIEWER ASKS
“Why do the math? Kinesis and Kafka autoscale.”
Strong answer: Autoscaling has limits and a price tag. Kinesis on-demand mode adapts to roughly double its recent peak; a 60× jump needs pre-warming or provisioned shards. Kafka partitions are provisioned ahead of time. And even an infinitely elastic broker would replicate and store 300 GB/s. The math turns “it scales” from a hope into a plan. It’s also how you notice that the design has to change shape, not just get bigger.
Scene 4: The whole pipeline, left to right
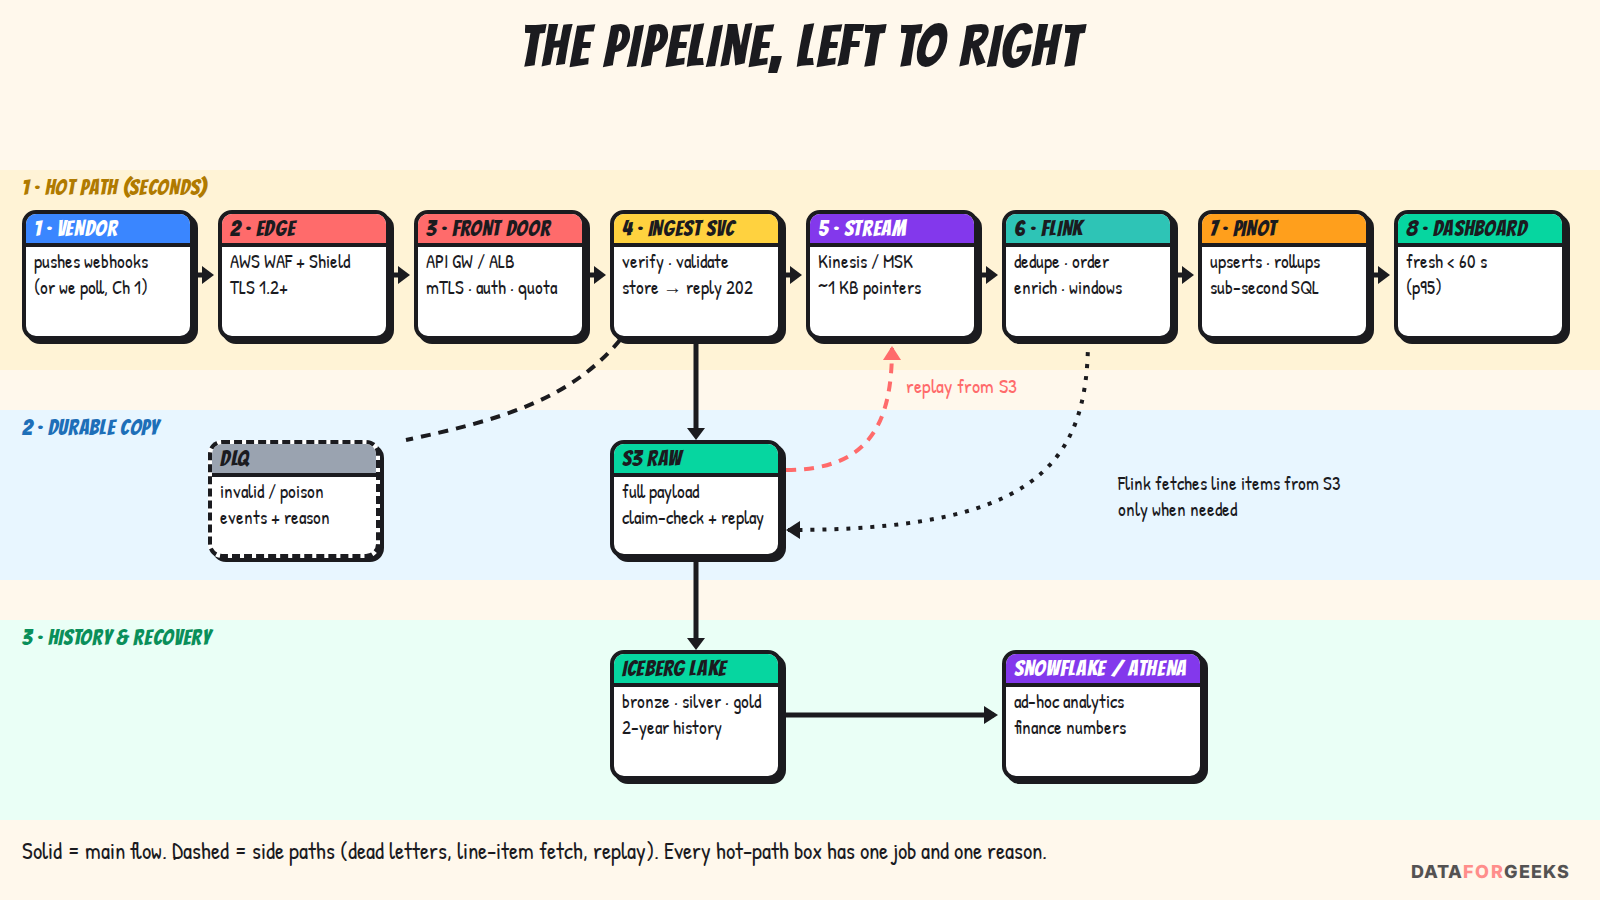
Now, and only now, Nikhil names tools. Each box gets one sentence of reason:
| Box | AWS choice | Open-source alternative | Why it exists |
|---|---|---|---|
| Edge | AWS WAF + Shield on the ALB / API Gateway | Envoy / NGINX + ModSecurity | Abuse, DDoS and size filtering. No CDN needed for one partner’s POSTs; add Global Accelerator only for multi-region failover |
| Front door | API Gateway or ALB (with mTLS) | Kong / Envoy / HAProxy | Auth, quotas, routing, health checks across AZs |
| Ingest service | ECS/EKS (Fargate), autoscaled | Any container platform | Verify, validate, store, publish, then reply 202 |
| Raw store | S3 (+ KMS) | MinIO / Ceph | Durable copy of every payload: claim-check and replay |
| Stream | Kinesis Data Streams or Amazon MSK | Apache Kafka / Redpanda / Pulsar | Buffer spikes, decouple producers from consumers |
| Schemas | Glue Schema Registry | Confluent / Apicurio registry | Contracts and safe evolution |
| Processing | Managed Service for Apache Flink | Apache Flink on Kubernetes | Dedupe, ordering, enrichment, windows |
| Real-time serving | Apache Pinot (self-managed or managed) / ClickHouse Cloud | Pinot / ClickHouse / Druid | Sub-second queries on fresh data |
| History | S3 + Iceberg, Athena / Snowflake / Redshift | Iceberg + Trino / Spark | 2-year history, ad-hoc analytics, replay |
| Dashboard | QuickSight / Managed Grafana | Superset / Grafana | What the business sees |
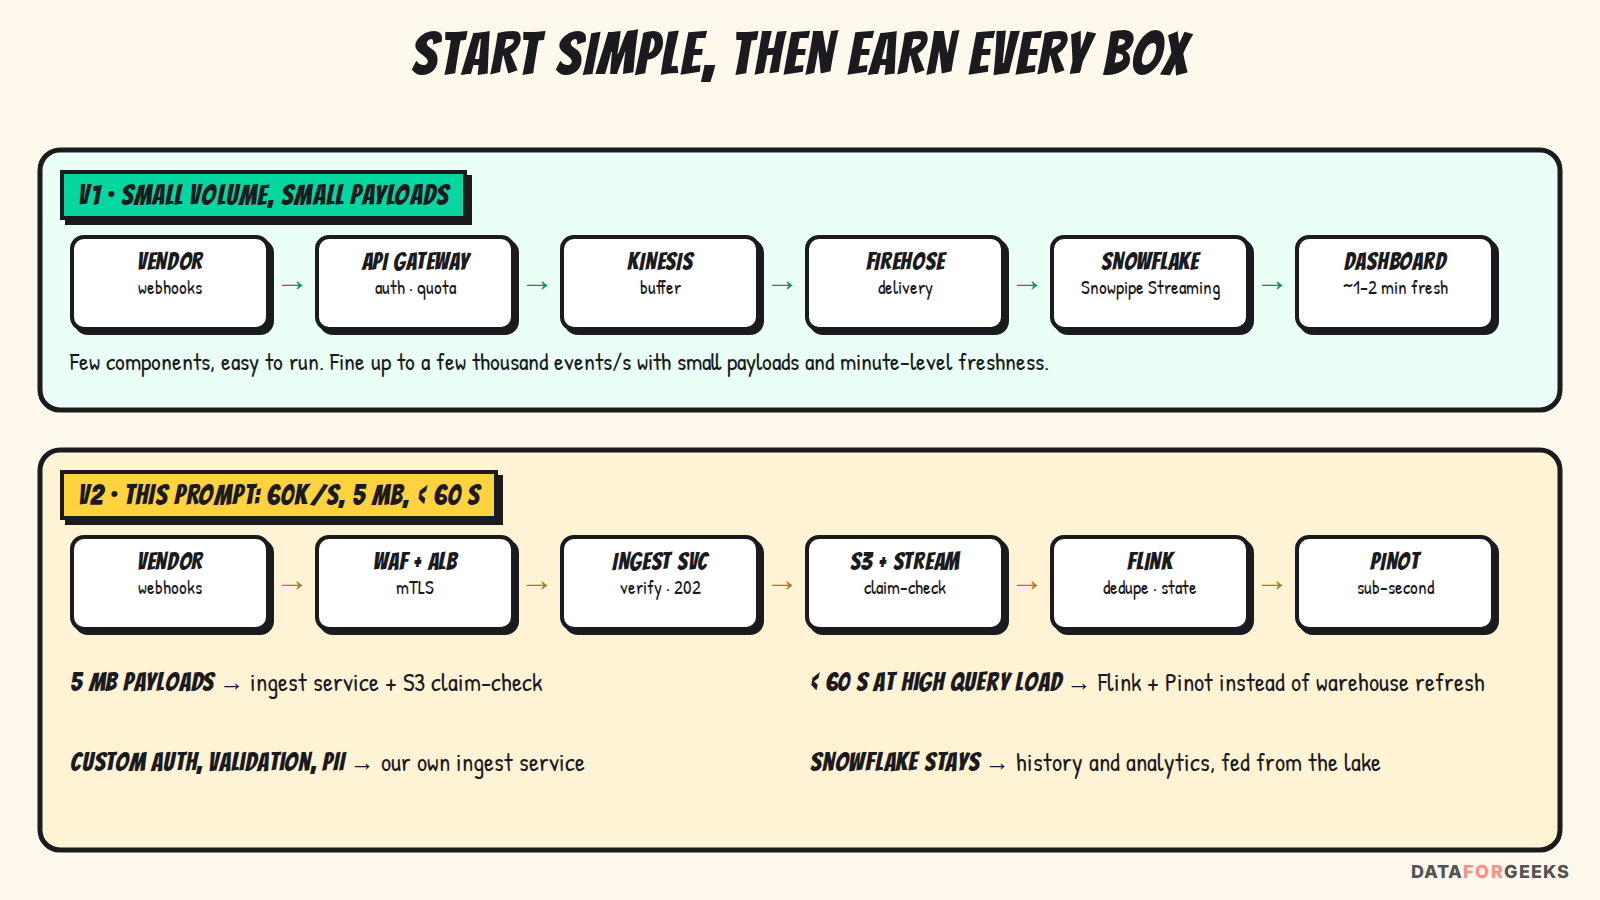
Why not start with all of this? Nikhil draws the simple version first, then shows which requirement forces each extra box. Interviewers reward that: it proves the complexity is necessary.
💡 Interview tip: Draw the data path first (vendor → dashboard in one line), then add side paths (dead letters, replay, history). A whiteboard with a clear main line is far easier to defend than a web of arrows.
Act II · Getting the data in
Chapter 1: Push or pull? Two front doors, one pipeline
The first real design decision is how data gets in. The vendor in our prompt pushes webhooks, but the interviewer adds: “And if they only offered a REST API we could call, what would change?” This is the most common variation of the question, and it’s worth preparing both, because many SaaS vendors support only one of them. This chapter covers push (1.1), pull (1.2), and how to choose or combine them (1.3).
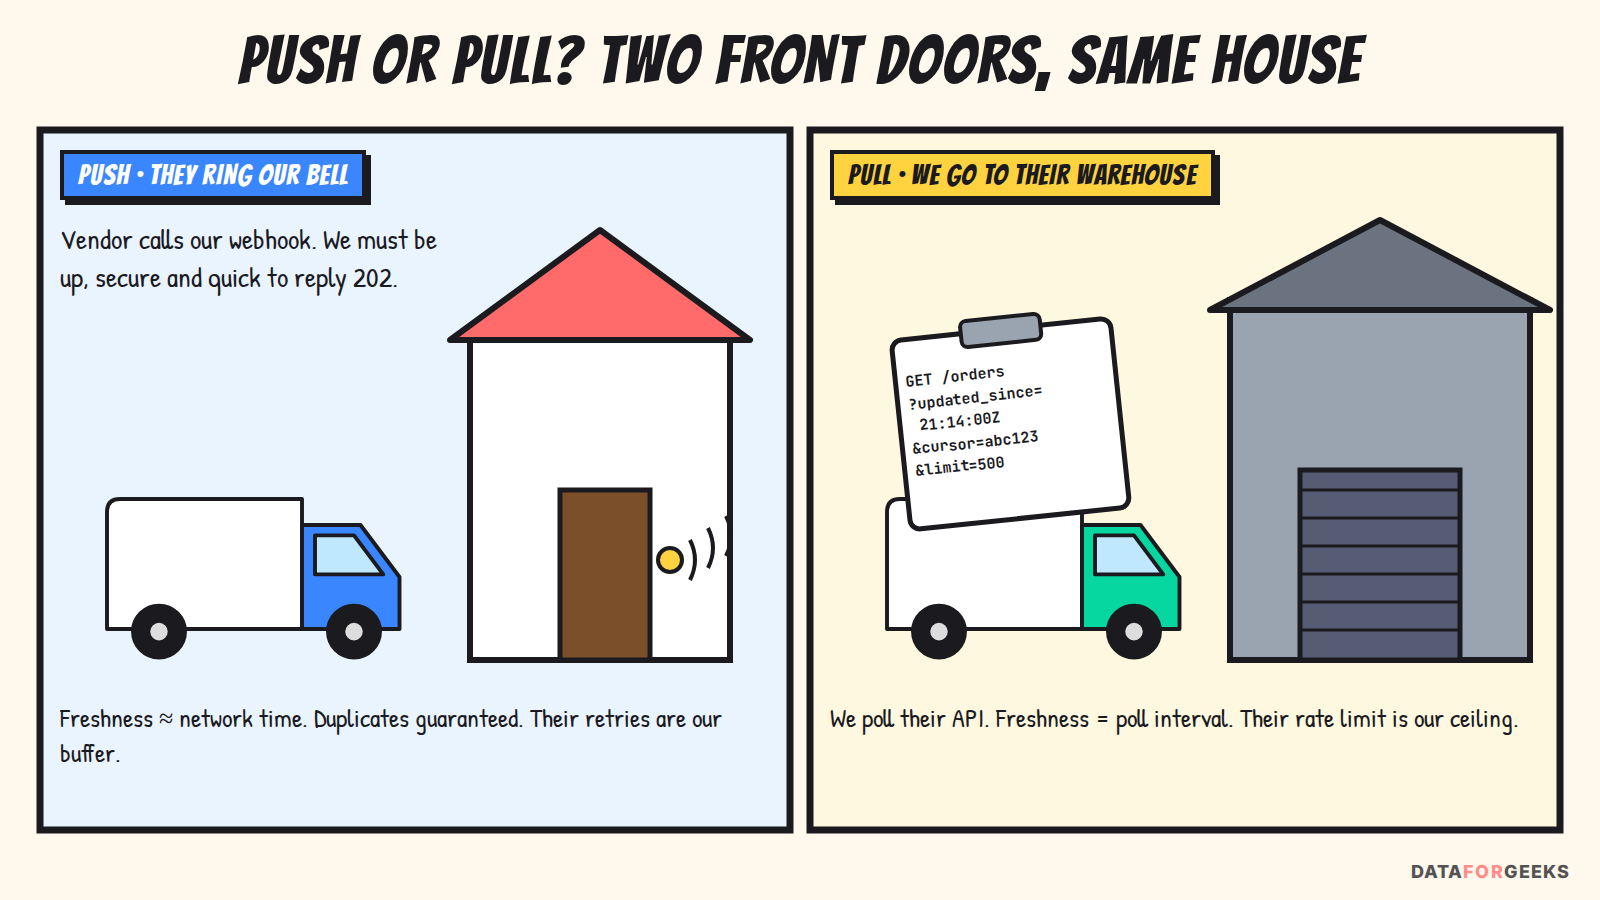
Nikhil starts with the headline: the door changes, the rest of the house stays the same. Whether events arrive by push or by pull, they land in the same place, raw payload in S3 and a pointer event in the stream, so everything from the stream onwards is identical. What changes is who controls the timing, where the limits are, and what can go wrong.
| Push (webhooks) | Pull (we poll their API) | |
|---|---|---|
| Who starts the transfer | The vendor, when something happens | We do, on a schedule |
| Freshness | Near-instant (network time) | At best the poll interval + page fetch time |
| Throughput ceiling | Our endpoint’s capacity | The vendor’s API rate limit |
| What we must run | A public, always-on, secure endpoint | Scheduled workers + stored cursors (no public endpoint) |
| Security direction | We verify them (mTLS, HMAC, OAuth) | They verify us (API key / OAuth client credentials, our static egress IPs) |
| Missed data risk | Our downtime beyond their retry window | Cursor bugs, clock skew, pagination edge cases |
| Duplicates | From their retries | From overlapping time windows (on purpose) |
| Backfill | Ask them to resend | Just re-run with an older cursor, within their limits |
| Spikes (sale day) | Hit us all at once; we must absorb them | We fetch at our own pace; we fall behind instead of falling over |
1.1 Push: running the always-on webhook endpoint
Why is there anything in front of the stream?
The interviewer’s first challenge: “Why do you need a load balancer? Why not let them write straight into Kafka or Kinesis?” A weak answer talks about regions and “spreading traffic”. A strong answer starts from the fact in the prompt: the vendor is outside our network.
- The contract with an outside party is HTTPS, not the Kafka protocol. Exposing brokers to the internet, handing out broker credentials, and making the vendor understand our partitions, limits and topic names would tie their code to our internals. Change the broker and you break the vendor.
- Something must run logic before the stream: verify signatures, validate schemas, enforce size limits and quotas, strip or tokenize PII, split payloads (Act III), and give a meaningful reply (202 / 400 / 401 / 413 / 429).
- The load balancer is a detail of the ingest service: it spreads requests across healthy instances in several availability zones and removes failed ones. That’s all it does, and saying so plainly is the strong answer. It doesn’t “route by region”, and it doesn’t make anything faster.
Three valid shapes for the front door, and when each fits:
- API Gateway → ingest service: managed auth, quotas, usage plans and request validation. The default choice for a small number of known partners. Mind the limits: 10 MB request payloads, and if you put Lambda behind it, Lambda’s ~6 MB synchronous request limit is uncomfortably close to our 5 MB payloads. Containers are the safer choice here.
- ALB (with mTLS) → ingest service: fewer per-request limits and cheaper at very high request rates. Auth and quotas move into the service.
- API Gateway → Kinesis direct integration (no code): elegant for small payloads, but no room for claim-check, dedupe or PII handling, so it doesn’t fit this prompt.
A fourth option is worth mentioning: if the vendor is an Amazon EventBridge SaaS partner, or also runs on AWS, EventBridge partner event sources or PrivateLink can replace the public endpoint entirely. Ask, because it removes a whole class of security work.
What “a public, secure, always-on endpoint” means on AWS
“Push” sounds simple (they call a URL), but we now run a piece of internet-facing infrastructure that must be up whenever the vendor sends. Here is the concrete setup:
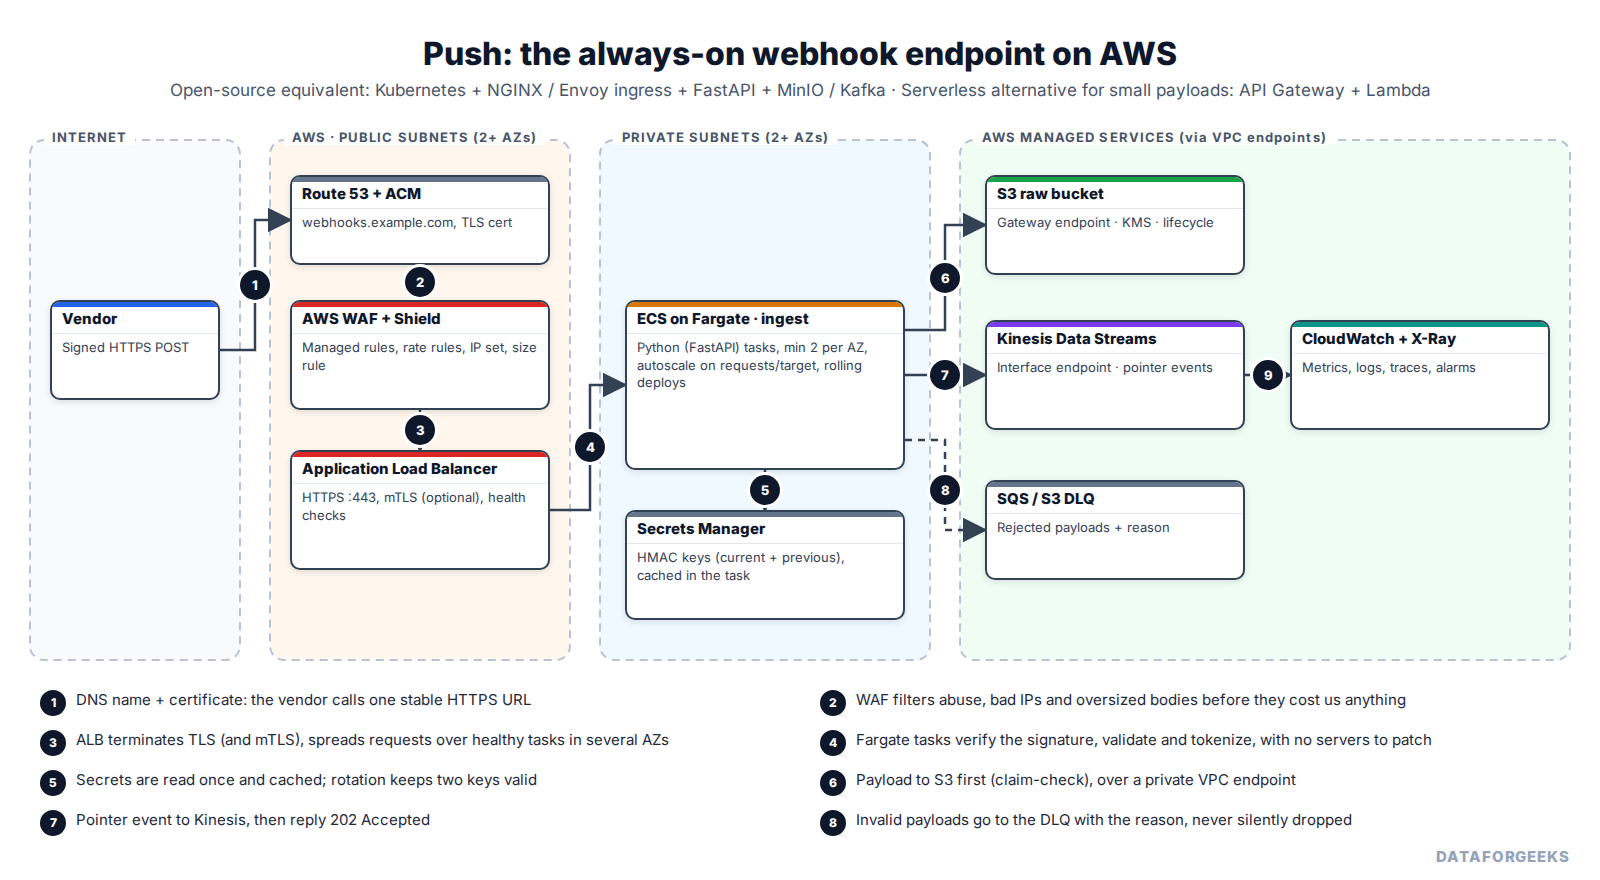
| Need | AWS service | Configuration that matters |
|---|---|---|
| A stable URL | Route 53 + ACM certificate | webhooks.example.com, an alias record to the ALB; ACM renews the certificate automatically |
| Filtering at the door | AWS WAF (+ Shield Standard, free) | Managed rule groups, rate-based rule, IP set (optional), body-size rule |
| Public entry point | Application Load Balancer in public subnets, 2–3 AZs | HTTPS listener :443, TLS 1.2+ policy, optional mTLS trust store, health check on /healthz |
| The code | ECS on Fargate in private subnets (or EKS if your team runs Kubernetes) | At least 2 tasks per AZ; target-tracking autoscaling on requests per target; scheduled scaling before sales; rolling deploys with automatic rollback |
| Private access to AWS services | VPC endpoints: gateway endpoint for S3, interface endpoints for Kinesis and Secrets Manager | Traffic never leaves AWS’s network, and no NAT is needed for the ingest path |
| Secrets | Secrets Manager + KMS | Read at startup and cached; refreshed every few minutes so rotation takes effect |
| Visibility | CloudWatch (metrics, logs, alarms) + X-Ray / OpenTelemetry | 5xx rate, latency, signature failures, payload sizes, per-vendor request counts |
“Always-on” in practice: multiple availability zones, a minimum task count that never scales to zero, health checks that remove bad tasks, deployments that roll back automatically on errors, and alarms on 5xx rate and latency. The vendor’s 24-hour retry window covers the rest.
Serverless alternative: API Gateway (HTTP API) + Lambda needs no servers or scaling setup and suits small payloads and moderate traffic. The catch for this prompt: synchronous Lambda requests are limited to ~6 MB, and at 60,000 requests/s you’d need a very high concurrency quota. For large payloads and sustained high throughput, containers are safer and cheaper. Open-source equivalent: Kubernetes with an NGINX or Envoy ingress in front of the same FastAPI service, writing to MinIO and Kafka.
THE INTERVIEWER ASKS
“Why not give the vendor credentials to write directly to Kinesis?”
Strong answer: It’s possible (cross-account IAM roles), and for a trusted, AWS-native partner sending small records it can even be right. Here it fails on three points: payloads up to 5 MB need claim-check logic we must own; we need validation and PII handling before data spreads to other systems; and we’d be locking an external company to our broker choice, partition scheme and limits. An HTTPS contract lets us change everything behind the door without calling the vendor.
THE INTERVIEWER ASKS
“Doesn’t the extra layer add latency?”
Strong answer: A few milliseconds, against a 60-second budget (Chapter 6 shows the breakdown). Latency is not the constraint here; correctness, security and survivability are. Say the number, then say why it doesn’t matter.
The whole front door in ~40 lines of Python
Here’s what the ingest service does for each request, as a minimal FastAPI app: verify the signature, store the payload, publish the pointer, reply 202. The signature scheme is explained in Chapter 2, and why we store before replying is explained in Chapter 3.
import hashlib, hmac, json, os, time
import boto3
from fastapi import FastAPI, HTTPException, Request
from starlette.concurrency import run_in_threadpool

app = FastAPI()
s3, kinesis = boto3.client("s3"), boto3.client("kinesis")
BUCKET, STREAM = os.environ["RAW_BUCKET"], os.environ["STREAM_NAME"]
KEYS = load_hmac_keys()            # {key_id: bytes} from Secrets Manager, refreshed periodically
MAX_BYTES, WINDOW_S = 5 * 1024 * 1024, 300

@app.post("/webhooks/orders", status_code=202)
async def receive(req: Request):
    body = await req.body()                                  # raw bytes: sign/verify BEFORE parsing
    if len(body) > MAX_BYTES:
        raise HTTPException(413, "payload too large")

    ts = req.headers.get("X-Vendor-Timestamp", "0")
    key = KEYS.get(req.headers.get("X-Vendor-Key-Id", ""))
    sig = req.headers.get("X-Vendor-Signature", "").removeprefix("sha256=")
    if not key or not ts.isdigit() or abs(time.time() - int(ts)) > WINDOW_S:
        raise HTTPException(401)
    expected = hmac.new(key, ts.encode() + b"." + body, hashlib.sha256).hexdigest()
    if not hmac.compare_digest(expected, sig):               # constant-time comparison
        raise HTTPException(401)

    order = json.loads(body)                                 # + schema validation → DLQ on failure
    eid = order["event_id"]
    prefix = hashlib.md5(eid.encode()).hexdigest()[:2]      # spread keys over 256 S3 prefixes
    s3_key = f"raw/vendor=shopsphere/{prefix}/{eid}.json"    # deterministic: retries overwrite

    # 1) durable copy first (claim-check)
    await run_in_threadpool(s3.put_object, Bucket=BUCKET, Key=s3_key, Body=body)
    # 2) small pointer event, partitioned by customer
    pointer = {k: order[k] for k in ("event_id", "order_id", "customer_id", "version", "event_ts", "total")}
    pointer |= {"item_count": len(order["items"]), "s3_uri": f"s3://{BUCKET}/{s3_key}",
                "received_ts": time.time()}
    await run_in_threadpool(kinesis.put_record, StreamName=STREAM,
                            Data=json.dumps(pointer).encode(), PartitionKey=order["customer_id"])
    return {"receipt": eid}                                  # 3) only now: 202 Accepted
A few notes you can mention in the interview:
- Any exception returns a 5xx, so the vendor retries. Because the S3 key is deterministic and Flink deduplicates, a retry is harmless.
- The S3 prefix is a hash, not the start of the ID. Time-ordered IDs (ULID, Snowflake) all begin with the same characters at the same moment, which would put all writes on one prefix.
- boto3 calls block, so they run in a thread pool (or use an async client like aioboto3). In production, add zstd compression before storing, a schema check, PII tokenization and structured logs with
event_id. For bodies near 5 MB, stream the upload to S3 instead of holding it in memory.
Running it: observability, scaling and alerting for the push endpoint
| What to do | |
|---|---|
| Watch | Requests/s per vendor · 2xx/4xx/5xx · p50/p99 latency (ALB TargetResponseTime) · signature/auth failures · 413 and 429 counts · payload size p50/p99 · S3 PUT latency · Kinesis WriteProvisionedThroughputExceeded · healthy task count per AZ |
| Scale | ECS target tracking on requests per target (plus CPU ~60%) · minimum 2 tasks per AZ · scheduled scale-out before known sales · check account quotas (Fargate vCPUs, Kinesis shards, ALB capacity) weeks ahead · stream pre-split or on-demand warm-up |
| Page someone when | 5xx > 1% for 5 min · p99 latency > 2 s · healthy tasks drop below minimum · no requests for 10 min when traffic is expected · sustained Kinesis throttling |
| Open a ticket when | Signature failures spike (vendor misconfigured or someone probing) · 413s rise (vendor payloads growing) · certificate or secret expires in < 30 days |
1.2 Pull: running the pollers
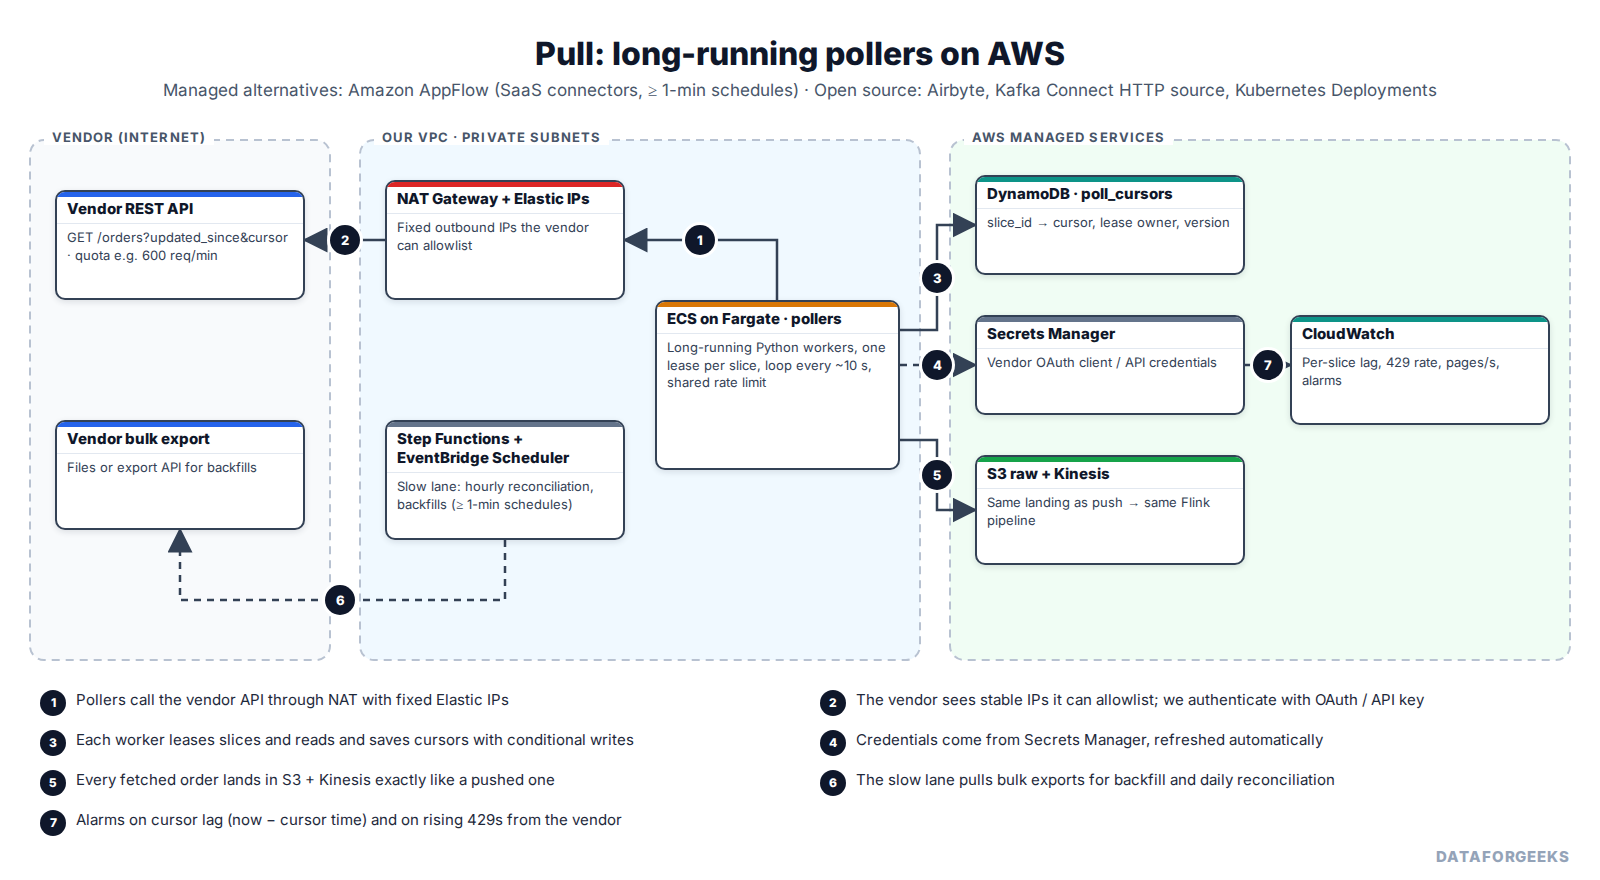
With pull there’s no public endpoint. We run workers that call the vendor’s API on our schedule, and the vendor’s rate limit becomes our ceiling.
The pull design, step by step
- Long-running pollers, not cron jobs: schedulers like EventBridge Scheduler or cron work in whole minutes (1-minute minimum), which is too slow for a 60-second budget. So the fast lane is a small always-on service (ECS/Fargate tasks) that loops: fetch, store, sleep ~10 s, repeat. Minute-level schedulers are fine for the slow lane (reconciliation, backfills).
- Incremental fetch with a cursor: call
GET /orders?updated_since=…&cursor=…&limit=500. Prefer the vendor’s opaque cursor or change token when they offer one. With timestamps, use a composite cursor(updated_at, order_id)so records sharing the same timestamp aren’t skipped. - Overlap on purpose: start each window a little before the last cursor (e.g. 2 minutes) to catch records written late or affected by clock skew on the vendor’s side. The duplicates this creates are removed by the same dedupe logic as in push (
order_id+version). - Store the cursor only after the data is safe: write the page to S3 and the stream first, then advance the cursor (in DynamoDB, with a conditional write). A crash means re-reading a page, never skipping one.
- Parallelise within their limits: split the work into independent slices (per store, per region, or per time slice, if the API supports it) with one cursor per slice and one lease per worker, so two pollers never walk the same slice.
- Respect their rate limit: a client-side token bucket sized to the vendor’s quota, honouring
429andRetry-Afterwith jittered backoff. Your whole design can’t be faster than their quota, so do this math in the interview. - Two lanes: a fast lane (frequent incremental polls for recent changes) and a slow lane (bulk export or full-sync API, nightly or on demand) for backfills and reconciliation, so a backfill never starves the fast lane.
- Same landing: each fetched record → raw payload to S3 → pointer event to the stream → everything downstream (Chapters 3–12) is shared.
For standard SaaS vendors, managed connectors (Amazon AppFlow, Airbyte) may already exist. Custom pollers win when you need sub-minute freshness, custom cursors or very high volume. The options are compared below.
Where the pollers run, and which services to use
| Option | Where it runs | Good for | Limits |
|---|---|---|---|
| ECS on Fargate service (recommended fast lane) | Long-running containers in private subnets | Polling every ~10 s, long page walks, steady state | You write the poller code |
| Lambda + EventBridge Scheduler | Serverless functions on a schedule | Low-volume feeds where 1–5 minute freshness is fine | Minimum 1-minute schedule, 15-minute max runtime |
| Amazon AppFlow | Fully managed | Standard SaaS sources (Salesforce, Zendesk, ServiceNow…) | Only supported connectors, minute-level schedules |
| Step Functions + AWS Batch / Glue | Managed orchestration + batch compute | Slow lane: bulk exports, backfills, reconciliation | Not for second-level freshness |
| EKS Deployment | Kubernetes pods | Teams already running Kubernetes | Cluster to operate |
| Open source | Airbyte, Kafka Connect HTTP source, Meltano | Many sources with one tool | Usually minute-level; custom cursors can be hard |
Supporting pieces:
- NAT gateway with Elastic IPs, so all outbound calls come from fixed IP addresses the vendor can allowlist.
- DynamoDB table
poll_cursors: one item per slice (slice_id, cursor, lease owner, lease expiry, version), updated with conditional writes so two workers never move the same cursor. - Secrets Manager for the vendor’s OAuth client credentials or API key. Access tokens are cached and refreshed before they expire.
- A shared rate limit: the simplest way is to split the vendor’s quota evenly (N workers → quota/N each). For precise sharing, use a token bucket in ElastiCache (Redis). Either way, honour
429 + Retry-After. - CloudWatch alarms on per-slice cursor lag (now − cursor time), 429 rate and pages per second.
A poller in ~35 lines of Python
import time, requests, boto3

cursors = boto3.resource("dynamodb").Table("poll_cursors")
API, OVERLAP_S, PAGE = "https://api.vendor.example/v1/orders", 120, 500

def poll_slice(slice_id, get_token, limiter, land):
    item = cursors.get_item(Key={"slice_id": slice_id})["Item"]
    since = int(item["high_water"]) - OVERLAP_S               # re-read a little on purpose
    high_water, page_cursor = int(item["high_water"]), None
    while True:
        limiter.acquire()                                     # stay under the vendor's quota
        r = requests.get(API, timeout=10,
                         headers={"Authorization": f"Bearer {get_token()}"},
                         params={"updated_since": since, "cursor": page_cursor, "limit": PAGE})
        if r.status_code == 429:                              # vendor says slow down
            time.sleep(int(r.headers.get("Retry-After", "5")))
            continue
        r.raise_for_status()
        page = r.json()
        for order in page["data"]:
            land(order)                                       # same S3 + Kinesis path as push
            high_water = max(high_water, order["updated_at_epoch"])
        page_cursor = page.get("next_cursor")
        if not page_cursor:
            break
    # save progress only after everything is safely landed; the version check stops two workers clashing
    cursors.update_item(Key={"slice_id": slice_id},
        UpdateExpression="SET high_water = :hw, version = version + :one",
        ConditionExpression="version = :v",
        ExpressionAttributeValues={":hw": high_water, ":v": item["version"], ":one": 1})

while True:                                                   # a long-running ECS task
    for slice_id in leased_slices():                          # leases stored in the same table
        poll_slice(slice_id, get_token, limiter, land)
    time.sleep(10)
Simplifications to call out: a production poller uses a composite cursor (updated_at, id) or the vendor’s own change token, renews its leases, retries network errors with backoff, and emits cursor-lag metrics. The important ideas are all there: overlap window, quota-aware fetching, landing before saving the cursor, and conditional writes.
THE INTERVIEWER ASKS
“Their API allows 600 requests per minute. Can you still meet 60 seconds at 60,000 orders per second?”
What they’re really testing: Whether you do the math and push back when a requirement is impossible.
Strong answer: “600 requests/min is 10 requests/s. Even at 500 orders per page, that’s 5,000 orders/s at most, and 60,000/s is 12× more than their API allows. So with pull alone, the sale-day freshness target can’t be met. The options are: negotiate a higher quota or a bulk/streaming export for the sale, switch to webhooks (or thin webhooks) for the peak, or agree that freshness degrades to a few minutes during the sale. Saying ‘this requirement conflicts with the vendor’s limits’ is the senior answer; quietly promising 60 seconds is not.”
THE INTERVIEWER ASKS
“You poll by updated_at. How do you make sure you never miss a record?”
Strong answer: Four safeguards. (1) A composite cursor (updated_at, id) so records with the same timestamp aren’t skipped when a page ends in the middle of them. (2) An overlap window to cover late-committed rows and clock skew on the vendor’s side. (3) Save the cursor only after the data is durable. (4) A daily reconciliation that compares counts per hour against the vendor (or against a full export) and re-fetches any gaps. Prefer the vendor’s change cursor if they have one: it avoids most of these problems.
Running it: observability, scaling and alerting for the pollers
| What to do | |
|---|---|
| Watch | Cursor lag per slice (now − high-water mark): this is pull’s freshness · pages/s and records per page · vendor 429 rate · vendor API latency and errors · token refresh failures · lease changes between workers · duplicates created by the overlap window |
| Scale | Add workers or slices until you reach the vendor’s quota: that’s the ceiling, not our CPU · autoscale the ECS service on a custom cursor-lag metric, capped by the quota · run backfills in a separate lane with a separate slice of the quota, so live polling never starves |
| Page someone when | Cursor lag > 60 s for 5 min (freshness breach) · vendor API 5xx/timeouts persist · authentication fails (expired or revoked credentials) |
| Open a ticket when | 429 rate > 20% (time to ask for a higher quota) · repeated lease conflicts · daily reconciliation finds a gap |
1.3 Hybrid, and choosing between them
The hybrid: “thin” webhooks
Many vendors send a small notification (“order 123 changed”) and expect you to fetch the full record from their API. This combines both designs: the webhook gives you freshness, and the fetch gives you the authoritative payload (and makes forged notifications harmless, since you only trust what their API returns). Budget API calls for the fetches, and batch them where the API allows (GET /orders?ids=…).
THE INTERVIEWER ASKS
“Which would you choose if the vendor offered both?”
Strong answer: “Both, in different roles. Webhooks for the real-time path (freshness, no quota), and the API for reconciliation and backfill (completeness). Each covers the other’s weakness: webhooks can be lost when retries run out, and polling can’t reach sub-minute freshness at high volume.”
Chapter 2: Who’s knocking? Proving it’s really the vendor
The interviewer leans in: “This vendor is on the public internet, outside our network. How do we make sure nobody else can send us data, and that what arrives hasn’t been tampered with?”
WHAT MATTERS MOST (IF YOU ONLY HAVE 60 SECONDS)
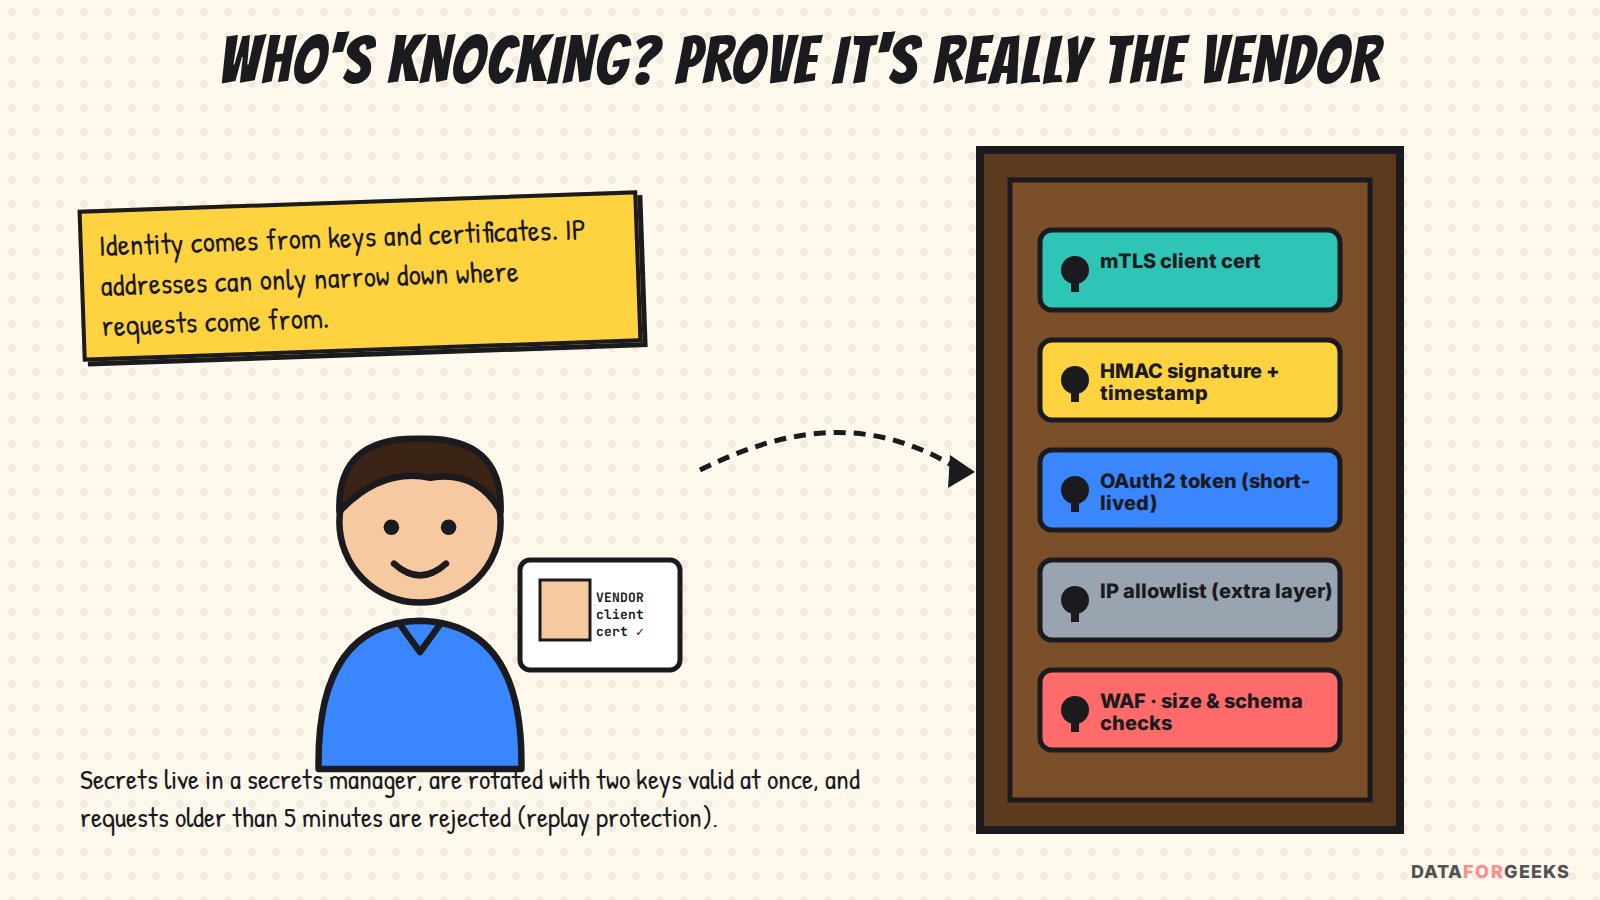
- One strong identity check: mTLS or HMAC-signed requests or OAuth2 client-credential tokens. Never IP address alone, never an API key alone.
- Integrity and replay protection: sign the raw body plus a timestamp, and reject old or reused requests.
- Per-vendor quotas and size limits at the door, so one partner (or attacker) can’t flood the pipeline.
- Secrets handled properly: stored in a secrets manager, rotated with two valid keys at once, never logged.
- Protect the data after it’s in: encryption, PII tokenization, least-privilege access, audit logs.
Everything else (IP allowlists, WAF rules, private connectivity) is defence in depth: useful, but not the main lock.
Start with the threats, not the tools
A strong answer names what could go wrong before choosing controls. That also stops you from adding security products you can’t justify.
| Threat | Example | Main control |
|---|---|---|
| Impersonation | Someone finds our URL and posts fake orders | mTLS / HMAC / OAuth2 identity |
| Tampering | A proxy changes an order total in transit | TLS + signature over the raw body |
| Replay | A captured valid request is re-sent 1,000 times | Timestamp window + event_id / nonce check |
| Flooding | A bug or attacker sends 10× the agreed rate | WAF rate rules + per-vendor quotas + 429 |
| Oversized or malformed input | A 500 MB body, deeply nested JSON, a “zip bomb” | Size limits, decompression limits, schema validation |
| Leaked credentials | The vendor accidentally commits the secret to a public repo | Rotation, short-lived tokens, anomaly alerts |
| Data exposure after ingest | An engineer reads raw payloads with customer emails | KMS encryption, tokenization, IAM, audit |
Layer 1: Transport security (TLS)
- What it does: encrypts traffic and proves our identity to the vendor (they verify our certificate).
- How: certificate from AWS Certificate Manager on the ALB or API Gateway custom domain, with a security policy that allows only TLS 1.2+ (prefer 1.3) and modern ciphers.
- What it doesn’t do: it doesn’t prove who the vendor is. Anyone on the internet can open a TLS connection to us. That’s what the next layers are for.
Layer 2: Vendor identity (choose at least one)
Option A: Mutual TLS (mTLS). The vendor also presents a certificate, so both sides prove who they are during the TLS handshake.
- How: we either issue the vendor a client certificate from our private CA, or trust the vendor’s CA. The CA bundle is uploaded as a trust store to the ALB, or to API Gateway (custom domain with mTLS). Connections without a valid certificate are rejected before any application code runs.
- Map certificate to vendor: the ALB forwards certificate details (subject, serial) in headers. The ingest service maps the certificate subject to a
vendor_idand checks it matches the vendor claimed in the payload. - Operations: revocation lists for compromised certificates, alerts 30 days before expiry, and an agreed renewal process. Certificate expiry is the #1 cause of mTLS outages.
- Watch out: mTLS must terminate on the component that holds the trust store. Anything in front that terminates TLS (a CDN, a proxy) breaks it unless that layer does the mTLS check itself.
Option B: HMAC-signed requests (the most common webhook pattern). The vendor signs each request with a shared secret, and we verify the signature.
# Vendor side
signed_payload = timestamp + "." + raw_body_bytes
signature      = HMAC_SHA256(secret, signed_payload)
headers: X-Vendor-Timestamp: 1790000000
         X-Vendor-Key-Id:    k2
         X-Vendor-Signature: sha256=9f2c…

# Our side (ingest service)
1. Reject if |now - timestamp| > 300 s               # replay window
2. Look up the secret for key id k2 (current or previous)
3. Recompute HMAC over the RAW bytes (before parsing JSON)
4. Compare with a constant-time comparison
5. Reject if event_id was already seen in the replay window (optional nonce check)- Why sign the raw bytes: parsing and re-serializing JSON changes whitespace and key order, so the signature won’t match. This is the most common implementation bug.
- Why the timestamp is signed too: otherwise an attacker could reuse an old signature with a new timestamp.
- Why constant-time comparison: a normal string comparison can leak, through response timing, how many characters matched.
- Key id header: lets two secrets be valid during rotation.
Option C: OAuth2 client credentials. The vendor gets a short-lived token from our identity provider and sends it with every request.
- How: the vendor calls our token endpoint (Amazon Cognito, Okta, Auth0…) with its client credentials, ideally a signed JWT assertion (
private_key_jwt) rather than a plain secret, and receives a JWT with scopeorders:write, valid for 5–60 minutes. - Validation: API Gateway’s JWT authorizer (HTTP APIs) or a Lambda authorizer checks the signature against the identity provider’s public keys, plus issuer, audience, expiry and scope.
- Pros: short-lived and easy to revoke, and scopes let you limit what each vendor can do. Cons: many webhook senders can’t fetch tokens, which is why HMAC is more common for webhooks.
What about API keys? A static API key in a header is the weakest option: it never expires, it’s easy to leak, and it doesn’t protect the body from tampering. API Gateway API keys in particular are meant for usage plans and quotas, not authentication. Use them to track and throttle a vendor, never as the only lock.
Layer 3: Network controls (defence in depth)
- IP allowlisting: many SaaS vendors publish their outbound IP ranges for exactly this purpose. Put them in an AWS WAF IP set, update them automatically from the vendor’s published list, and treat them as an extra filter. IPs are not identity: they’re shared (NATs, cloud egress pools), they change, and anyone inside an allowed range passes the check.
- Private connectivity: if the vendor also runs on AWS, PrivateLink (we expose an endpoint service behind a Network Load Balancer; they connect through an interface endpoint) keeps traffic off the public internet entirely. A site-to-site VPN is the older option. Both need the vendor’s cooperation, so ask early.
- AWS WAF + Shield: managed rule groups for common attacks, rate-based rules, and body size rules. Note that WAF only inspects the first part of large request bodies, so full validation must happen in the service.
Layer 4: Input safety at the door
- Size limits: reject bodies above the agreed maximum with
413. Enforce it at the load balancer or gateway and in the service. - Decompression limits: if the vendor sends gzip, cap the decompressed size and ratio, so a 1 MB compressed “zip bomb” can’t expand into 10 GB.
- Content type and schema: accept only
application/json(or the agreed format), validate against the registered schema, and send failures to the DLQ with a reason. Never silently drop them. - Per-vendor quotas: a token bucket per
vendor_id(in the gateway’s usage plan or in the service), returning429 + Retry-After. The limit is written into the integration contract.
Layer 5: Secrets and credentials
- Secrets and private keys live in AWS Secrets Manager (or HashiCorp Vault), encrypted with KMS, readable only by the ingest service’s IAM role.
- Rotation without downtime: create secret v2 → share it with the vendor → accept both v1 and v2 (key id header) → vendor switches → revoke v1.
- Never log secrets, signatures or full request headers. Mask them in logs and traces.
- One separate secret per vendor, so one leak never affects another partner.
Layer 6: Protecting the data once it’s inside
- Encryption at rest with dedicated KMS keys for the raw bucket and the stream, and TLS inside the VPC too.
- PII tokenization at the edge: emails, phone numbers and addresses are replaced with tokens in the pointer event. Only a few restricted roles can read raw payloads.
- Least privilege: separate IAM roles for ingest (write raw), processing (read raw, write silver) and analytics (read tokenized only).
- Audit: CloudTrail and S3 access logs for every read of raw data.
Layer 7: Watching the door
- Alert on spikes in signature failures or 401/403s (a misconfigured vendor, or someone probing), on traffic from unexpected sources, and on volume far above the vendor’s normal pattern.
- Alert 30 days before any certificate or secret expires.
- Keep a runbook for “the vendor’s secret leaked”: rotate, review, quarantine.
And when we are the caller (pull mode)
In pull mode (Chapter 1.2) the roles reverse: the vendor verifies us. Store our API credentials or OAuth client secret in Secrets Manager, refresh tokens automatically, and send outbound traffic through NAT gateways with fixed Elastic IPs so the vendor can allowlist us.
THE INTERVIEWER ASKS
“Can’t we just allowlist the vendor’s IP addresses?”
What they’re really testing: Whether you confuse network location with identity.
Strong answer: “As an extra layer, yes, if the vendor publishes stable egress ranges; many do. But not as the identity check: egress IPs are shared and change, and a stolen secret used from inside an allowed range would still pass. Identity comes from mTLS or signed requests; IP allowlisting only narrows where requests can come from.”
THE INTERVIEWER ASKS
“mTLS or HMAC: which would you pick?”
Strong answer: “Whichever the vendor can support. That’s often the deciding factor. Most webhook platforms support HMAC signing out of the box, so it’s the usual default. mTLS is stronger (the identity check happens before any of our code runs, and there’s no shared secret) but needs certificate management on both sides. For a high-value partner I’d use both: mTLS for the connection, HMAC for the payload.”
THE INTERVIEWER ASKS
“The shared HMAC secret leaks. What now?”
Strong answer: Rotate immediately using the dual-key window (new key valid, old key revoked), check logs for signatures from unexpected sources or unusual volume, and quarantine events received during the exposure window for review (the raw archive makes this possible). Long term: move to mTLS or short-lived OAuth tokens, and add anomaly alerts so the next leak is noticed in minutes.
SECURITY CHECKLIST: WHAT TO SAY IN THE INTERVIEW
| Priority | Control | Why |
|---|---|---|
| Must | TLS 1.2+ with a managed certificate | Confidentiality, our identity |
| Must | mTLS, HMAC signature or OAuth2 token | Vendor identity + integrity |
| Must | Signed timestamp, 5-minute window, event_id check | Replay protection |
| Must | Per-vendor quotas, size and decompression limits, schema validation | Flooding and malformed input |
| Must | Secrets Manager, dual-key rotation, no secrets in logs | Credential safety |
| Must | KMS encryption, PII tokenization, least-privilege IAM, audit | Data safety after ingest |
| Should | AWS WAF managed rules + rate rules, Shield | Broad abuse protection |
| Should | Auth-failure, volume and expiry alerts + leak runbook | Detect problems fast |
| Nice | IP allowlist of the vendor’s published ranges | Extra filter, not identity |
| Nice | PrivateLink / VPN if the vendor supports it | Removes public exposure entirely |
Chapter 3: Say “202”, then never count twice
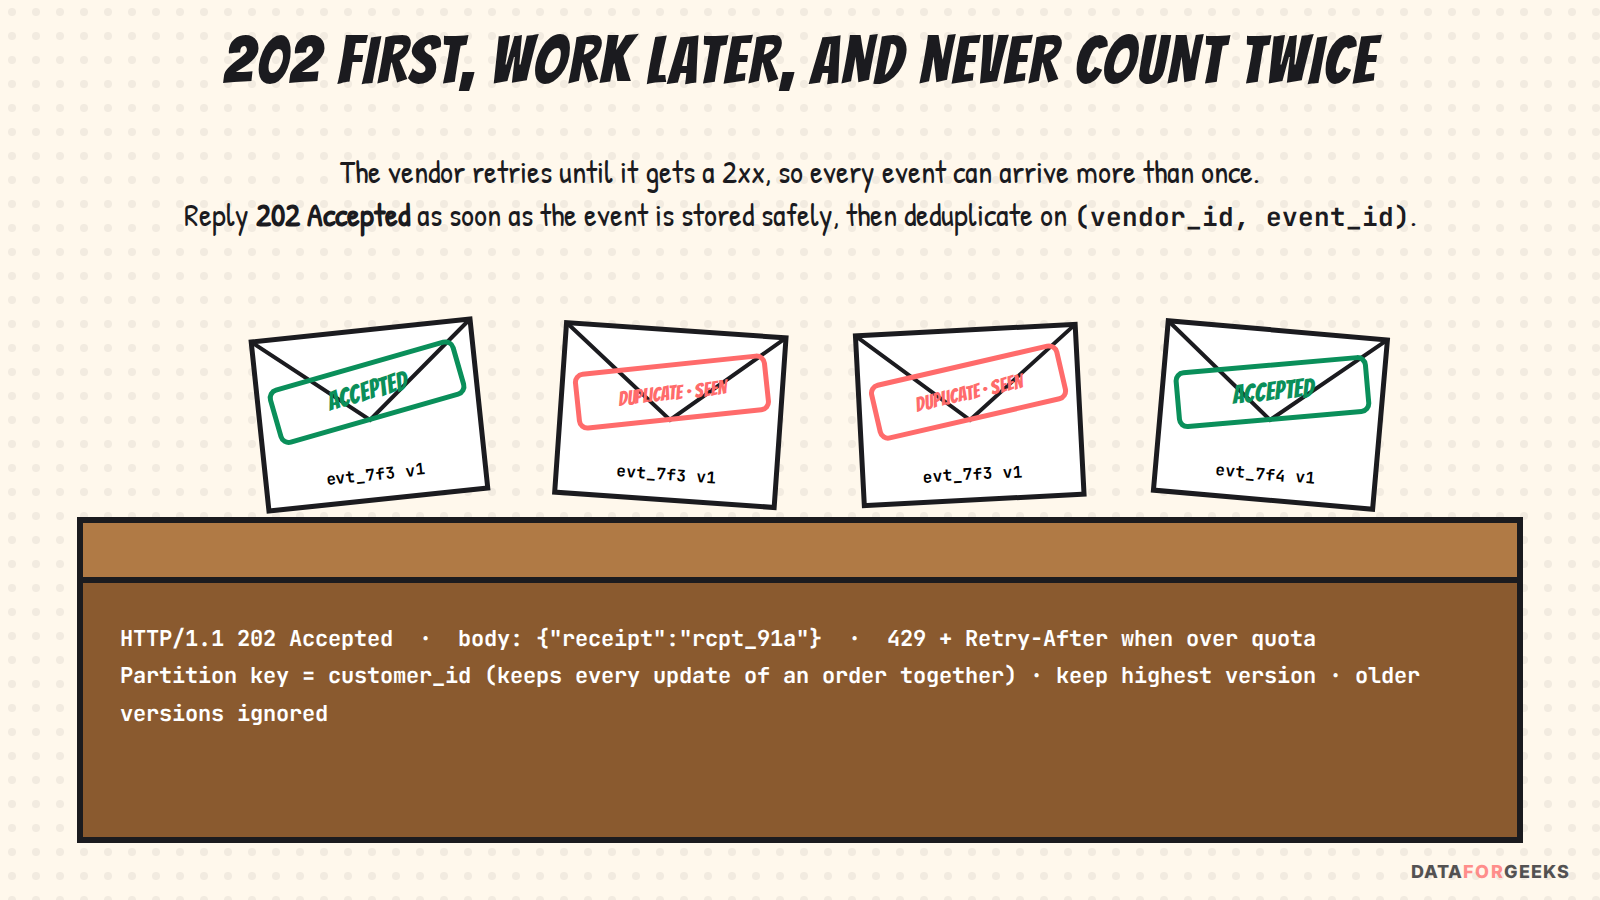
The acknowledgement contract is where reliability is won or lost:
- Reply
202 Acceptedonly after the event is stored durably: payload in S3 and pointer in the stream. Never reply after “received into memory”, and never make the vendor wait for processing. - The vendor retries on anything that isn’t 2xx, so the edge is always idempotent: the S3 key is deterministic (
vendor/…/event_id), so a retry overwrites the same object with the same bytes. - Dedupe on
(vendor_id, event_id)in Flink keyed state with a TTL longer than the vendor’s retry window (24 h + margin). - Ordering: the vendor doesn’t guarantee it, so we resolve it. Keep the highest
versionperorder_idand ignore older ones. - Partition key =
customer_id: every update of an order stays in one partition (an order belongs to one customer), and customer-level queries later touch a single partition. One key serves both goals. Watch for very large B2B customers who could make one partition hot. - Pull mode follows the same rules: land the data (S3 + stream) first, then advance the cursor. Duplicates from the overlap window are removed by the same dedupe.
- Backpressure: if the stream throttles, retry with jittered backoff. If it still fails, return 503 so the vendor’s retry queue becomes our buffer.
THE INTERVIEWER ASKS
“S3 write succeeded, but the stream put failed. What happens?”
Strong answer: We return 5xx, and the vendor retries. The retry writes the same S3 key (a harmless overwrite) and tries the stream again. Order matters: S3 first, then the stream, so a pointer can never point at a missing object. If a crash leaves an S3 object with no pointer, a small sweeper (or S3 event notifications) republishes it, and dedupe absorbs any double. Nothing is lost and nothing is counted twice.
THE INTERVIEWER ASKS
“Our ingest service is down for 30 minutes. What happens?”
Strong answer: The vendor’s 24 h retry window covers it: their queue becomes our buffer, and the data arrives late but complete. The dashboard shows the freshness breach (we measure it; see Chapter 10). We run multi-AZ to make this rare. For anything longer, we ask the vendor to resend by time range and reconcile counts. Knowing your partner’s retry policy is part of the design.
THE INTERVIEWER ASKS
“The vendor suddenly stops sending. How would you even know?”
Strong answer: Silence looks exactly like a quiet day unless you watch for it. Alert when events per minute drop below the expected value for that hour and weekday (a “dead man’s switch”), check the vendor’s status page, and run a daily reconciliation against their counts. The worst outages are the ones that don’t produce any errors.
Act III · The sale-day spike
Chapter 4: 60× more events
The interviewer turns up the pressure: “It’s Thanksgiving. Events jump from 1,000 to 60,000 a second. Walk me through every layer.”
A strong answer goes layer by layer and names the limit of each one, instead of saying “everything autoscales”:
| Layer | What limits it | How we scale it |
|---|---|---|
| Edge / WAF | Rate rules, TLS handshakes | Managed; raise the per-vendor rate limit for the sale in advance |
| API Gateway / ALB | Account quotas, per-client throttles | Request quota increases weeks ahead; ALBs scale automatically but prefer gradual ramps, so for a known sale reserve or pre-warm load balancer capacity with AWS |
| Ingest service | CPU (signature checks, compression), network, connections | Stateless, target-tracking autoscaling on requests per target; scheduled pre-scaling before the sale starts |
| S3 | ~3,500 PUT/s per prefix | Hash-prefixed keys over ≥ 20 prefixes |
| Stream | Kinesis: ~1 MB/s or 1,000 records/s per shard; MSK: provisioned brokers and partitions | Pointer events (1 KB) → ~60–120 shards; pre-split before the sale or use on-demand with warm-up; Kafka partitions sized for peak |
| Flink | Parallelism, state size, checkpoint time | Parallelism ≥ number of shards/partitions; autoscaling on backpressure; RocksDB state |
| Pinot | Consuming segments per partition, server CPU | One consuming segment per stream partition; scale servers; replicas for query load |
Two principles tie it together. The stream absorbs spikes: if consumers fall behind for 20 seconds, nothing is lost; lag rises and then drains. Protect the path, not the peak: if everything else fails, returning 429/503 to the vendor is safe, because their retries turn our overload into delay, not data loss.
THE INTERVIEWER ASKS
“Kinesis on-demand autoscales. Why pre-warm anything?”
Strong answer: On-demand mode handles growth up to about double its recent peak and adapts over minutes, while a sale goes from 1k to 60k in seconds. So for known events we pre-scale (switch to provisioned shards for the day, or warm the stream up with synthetic load), pre-scale Flink and the ingest service on a schedule, and load-test last year’s traffic shape. Autoscaling is for surprises; calendars are for known peaks.
Chapter 5: …and each event is 5× bigger
Nikita is one of the shoppers that evening: 480 items in one festival-sale basket. Her single order.created event is 5 MB of JSON. Now multiply by thousands of shoppers a second.
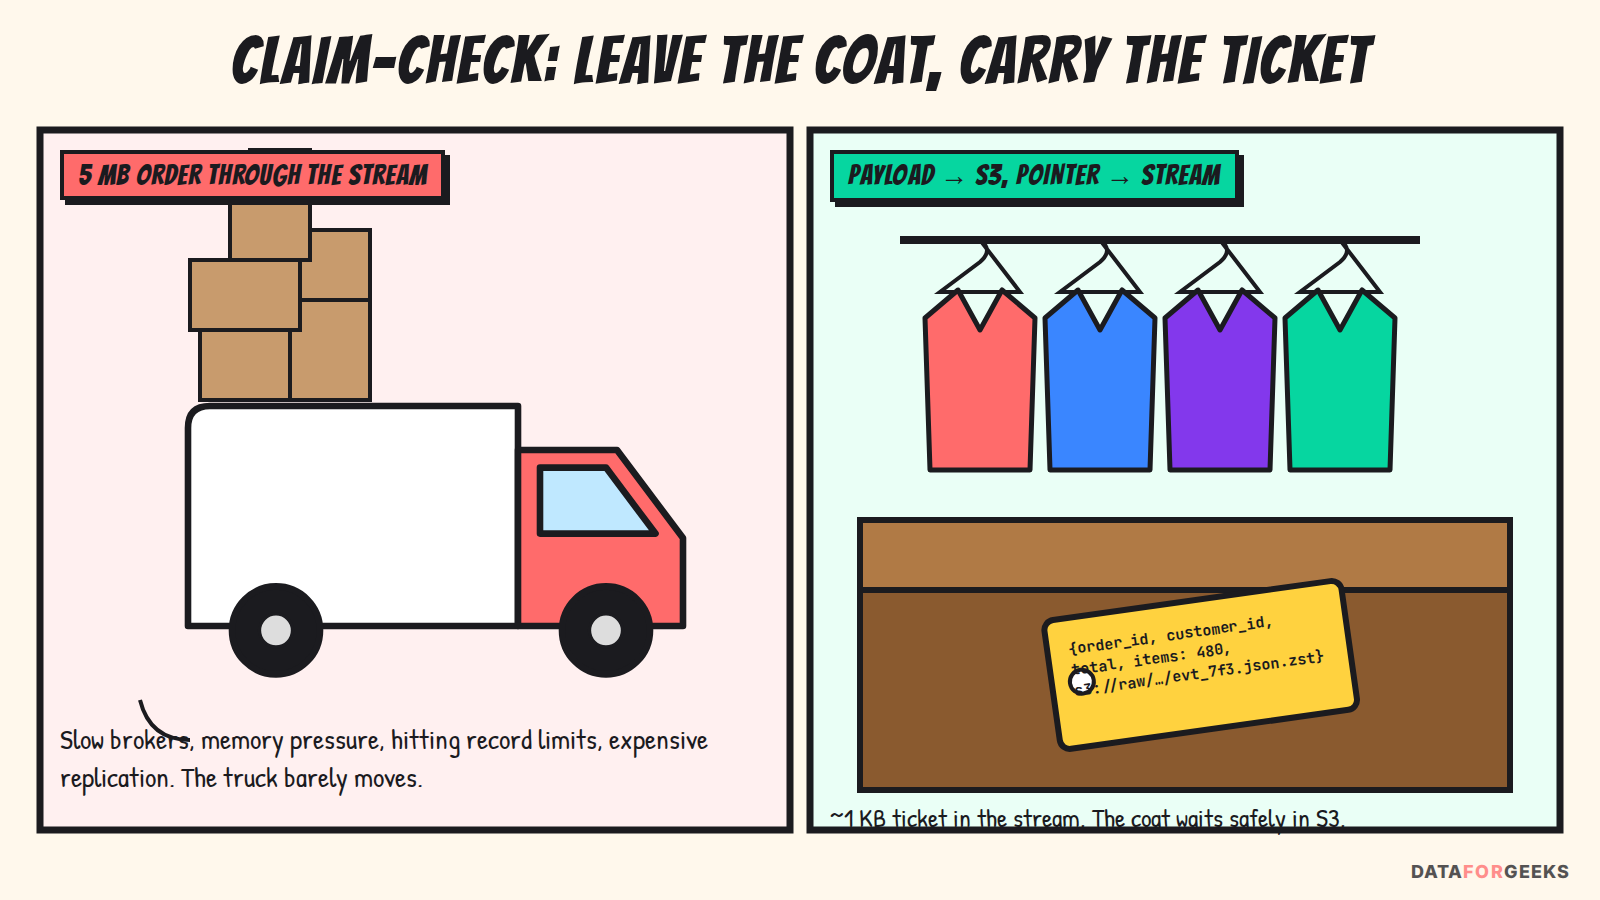
The interviewer asks the classic question: “Kafka’s default message limit is about 1 MB. Just raise it?” Raising limits is the last option, not the first. (Kinesis now accepts records up to 10 MiB, but per-shard throughput is still ~1 MB/s, so a 5 MB record uses five seconds of a shard’s write capacity.) Big messages hurt everything: broker memory, replication traffic, consumer fetch sizes, rebalances, and end-to-end latency.
Here are the options, from most to least effective:
- Claim-check pattern. The ingest service streams the payload into S3 (
s3://raw/vendor=…/dt=…/hash/event_id.json.zst), then publishes a ~1 KB pointer event:event_id, order_id, customer_id, version, event_ts, total, item_count, s3_uri. Most dashboard metrics need only these header fields. Line-item detail is fetched from S3 by the jobs that need it. - Compress. zstd or gzip shrinks JSON 5–10×, both at rest and on the wire (ask the vendor to send
Content-Encoding: gzip). - Split the order into header + line items. Put the header on the hot topic and line items on a separate topic keyed by
order_id, each withline_noandline_countso consumers can tell when they have them all. This works well for per-item metrics. - Binary schema. Avro or Protobuf with a schema registry is smaller and faster than JSON, and schema changes become explicit contracts.
- Negotiate with the vendor. Send deltas (“item 17 quantity changed”), not the full 480-item basket on every update. Batch small events into one request. Partners often agree when you show them the numbers.
- Raise limits only for the rare outliers, with a hard maximum (reply
413 Payload Too Largeabove it and alert).
THE INTERVIEWER ASKS
“Splitting payloads adds another service. Won’t that become the bottleneck?”
What they’re really testing: Whether you add boxes without thinking about their capacity.
Strong answer: It isn’t a new layer: the ingest service we already need does it while it handles the request. It’s stateless and limited by network and CPU, so it scales horizontally just like the endpoint. Streaming the upload to S3 (multipart for large bodies) means we never hold 5 MB × thousands of requests in memory. Size it by bytes, not requests: one instance can move roughly 1 GB/s of network traffic, so the raw worst case (300 GB/s) would need hundreds of instances, which is one more reason to insist on compression and deltas. At 5× compression the peak is ~60 GB/s, about 60–100 instances, pre-scaled for the sale. The stream behind it carries only 1 KB events, which is where the real saving is.
THE INTERVIEWER ASKS
“Isn’t 60,000 S3 PUTs per second expensive?”
Strong answer: Yes, and a good candidate notices it. At about $0.005 per 1,000 PUTs, 60k/s costs ~$0.30 a second, ~$1,000 an hour at peak. The fix is a hybrid: events under a threshold (say 256 KB compressed) travel inline in the stream, and only large ones use claim-check. Most events are small, so most of the PUT cost disappears while the large ones stay safe.
Act IV · The 60-second promise
Chapter 6: Where do the 60 seconds go?
“Real-time” isn’t a technology, it’s a budget. Nikhil splits the 60 seconds into stages, so every design choice has a number to meet:
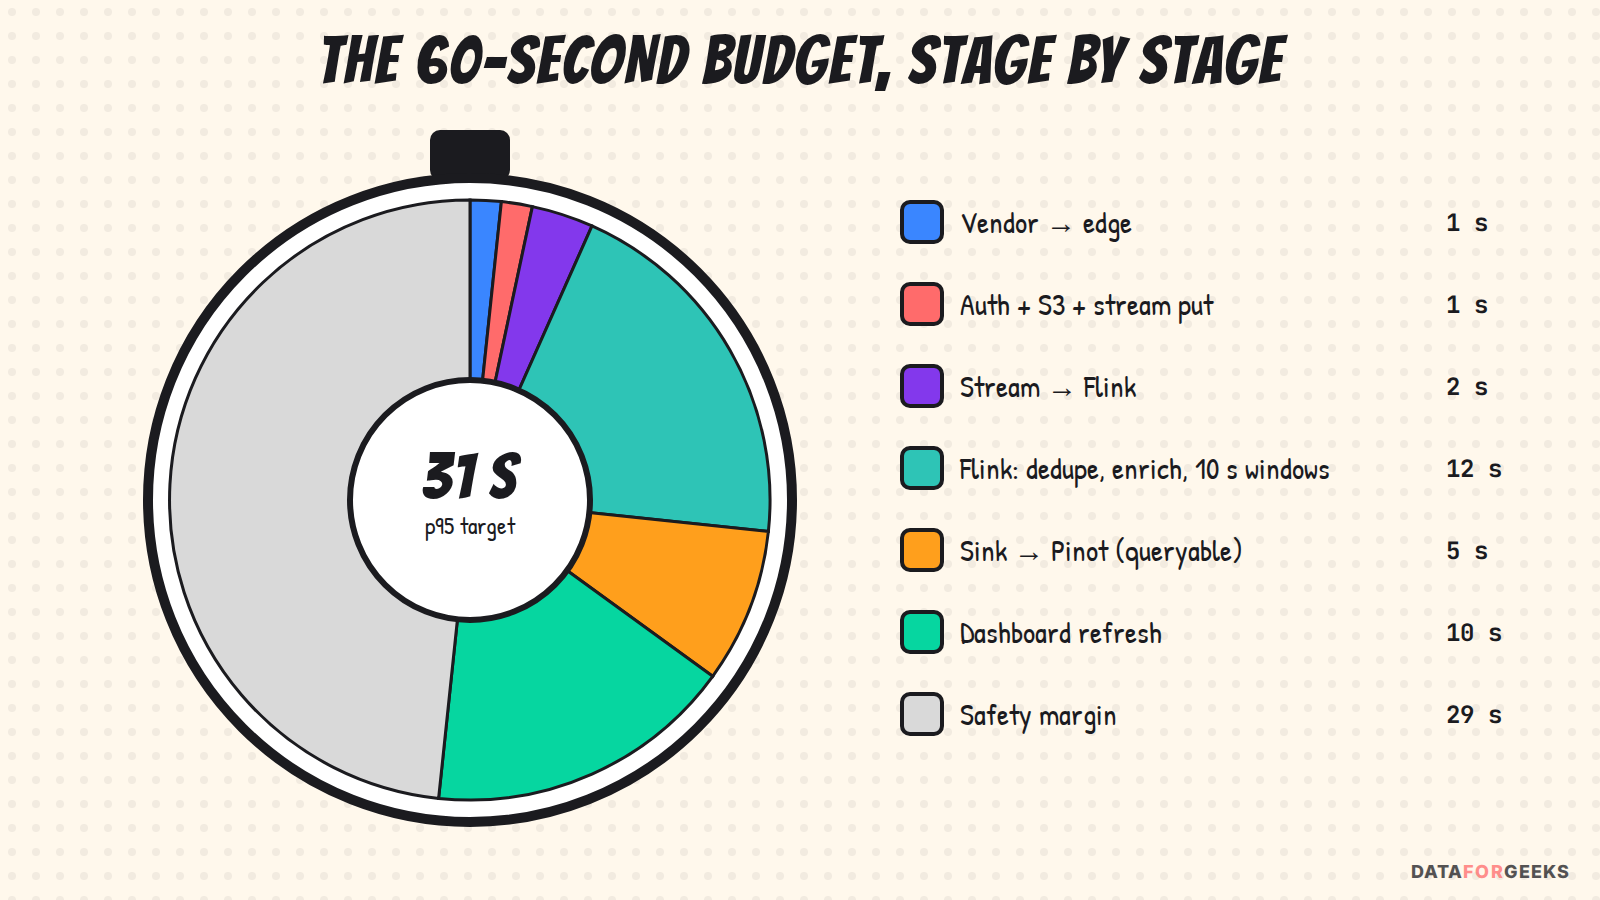
What Flink does in those 12 seconds:
- Parse and validate the pointer event against the registry schema. Anything invalid goes to the DLQ with the reason.
- Dedupe on
(vendor_id, event_id)in keyed state (TTL ~26 h). - Resolve order state per
order_id: keep the highestversion, and turncancelledinto a status change (not a delete). - Enrich with small reference data (region, customer segment) via broadcast state, and fetch line items from S3 with async I/O only for the jobs that need them.
- Emit two outputs: an upsert stream of current order state (to Pinot) and 10-second tumbling-window aggregates (orders, GMV, average order value by region), with watermarks for late events.
- Exactly-once where it matters: checkpoints every ~10 s. Sinks are idempotent (upserts by
order_id), so a replay after failure gives the same numbers.
THE INTERVIEWER ASKS
“Why not Firehose into Snowflake? We use Snowflake already.”
What they’re really testing: Whether you can defend a tool choice against the team’s favourite, honestly.
Strong answer: “For history and analytics, yes: Firehose (or the Snowflake Kafka connector) with Snowpipe Streaming lands rows in seconds, and I’d keep that path. For the sub-minute dashboard, I’d be careful: Dynamic Tables have a minimum target lag of one minute, so any transformation chain built on them already uses the whole budget, and a warehouse serving hundreds of dashboard users refreshing every few seconds gets expensive. If the dashboard is small and the queries hit raw landed rows directly, Snowflake can work. For high concurrency and strict freshness, a real-time OLAP store is the safer choice.” Being fair to the tool you’re not picking is a sign of seniority.
Chapter 7: Picking the serving store
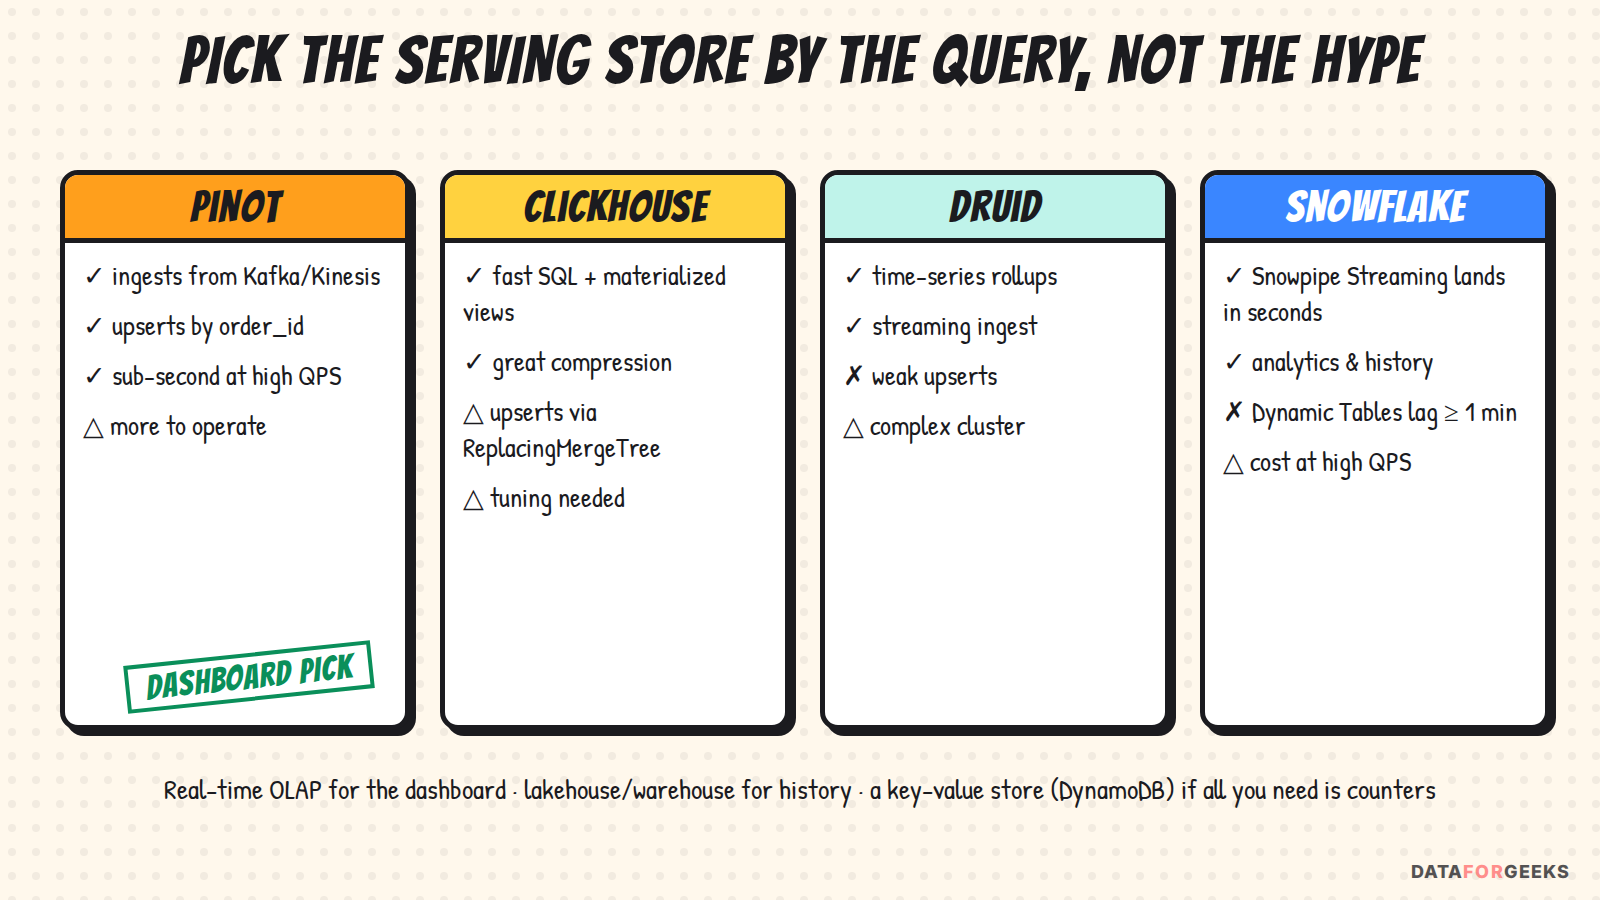
Nikhil picks the store from the queries, not the other way round. The queries are: counts and GMV per minute (aggregations over fresh data), orders per customer over 6 weeks or 6 months (point lookups + time range), and top items (group by over recent data). They need sub-second answers, many concurrent users, and data less than a minute old.
- Apache Pinot (the pick): ingests directly from Kinesis or Kafka, makes rows queryable within seconds, supports upsert tables (primary key
order_id, keep the row with the highestversion), and has indexes built for this: an inverted/sorted index oncustomer_id, time-based pruning and star-tree pre-aggregation. One important detail: upsert tables need the stream partitioned so that all records for a key land in the same partition. Ourcustomer_idpartition key from Chapter 3 already guarantees that fororder_id. - ClickHouse: excellent SQL, materialized views for rollups, very good compression. Upserts via
ReplacingMergeTreeare eventually merged, so queries needFINALor careful handling. A strong alternative, especially if the team knows it. - Druid: great for time-series rollups, weaker for per-order upserts.
- DynamoDB counters: if the only query were “orders per customer”, atomic counters per
(customer_id, day)would be simplest. But updates and cancellations make counters fragile, and ad-hoc slicing is impossible. - Snowflake: the history and analytics layer (Chapter 6).
Chapter 8: Modeling for the dashboard: counting Nikita’s orders
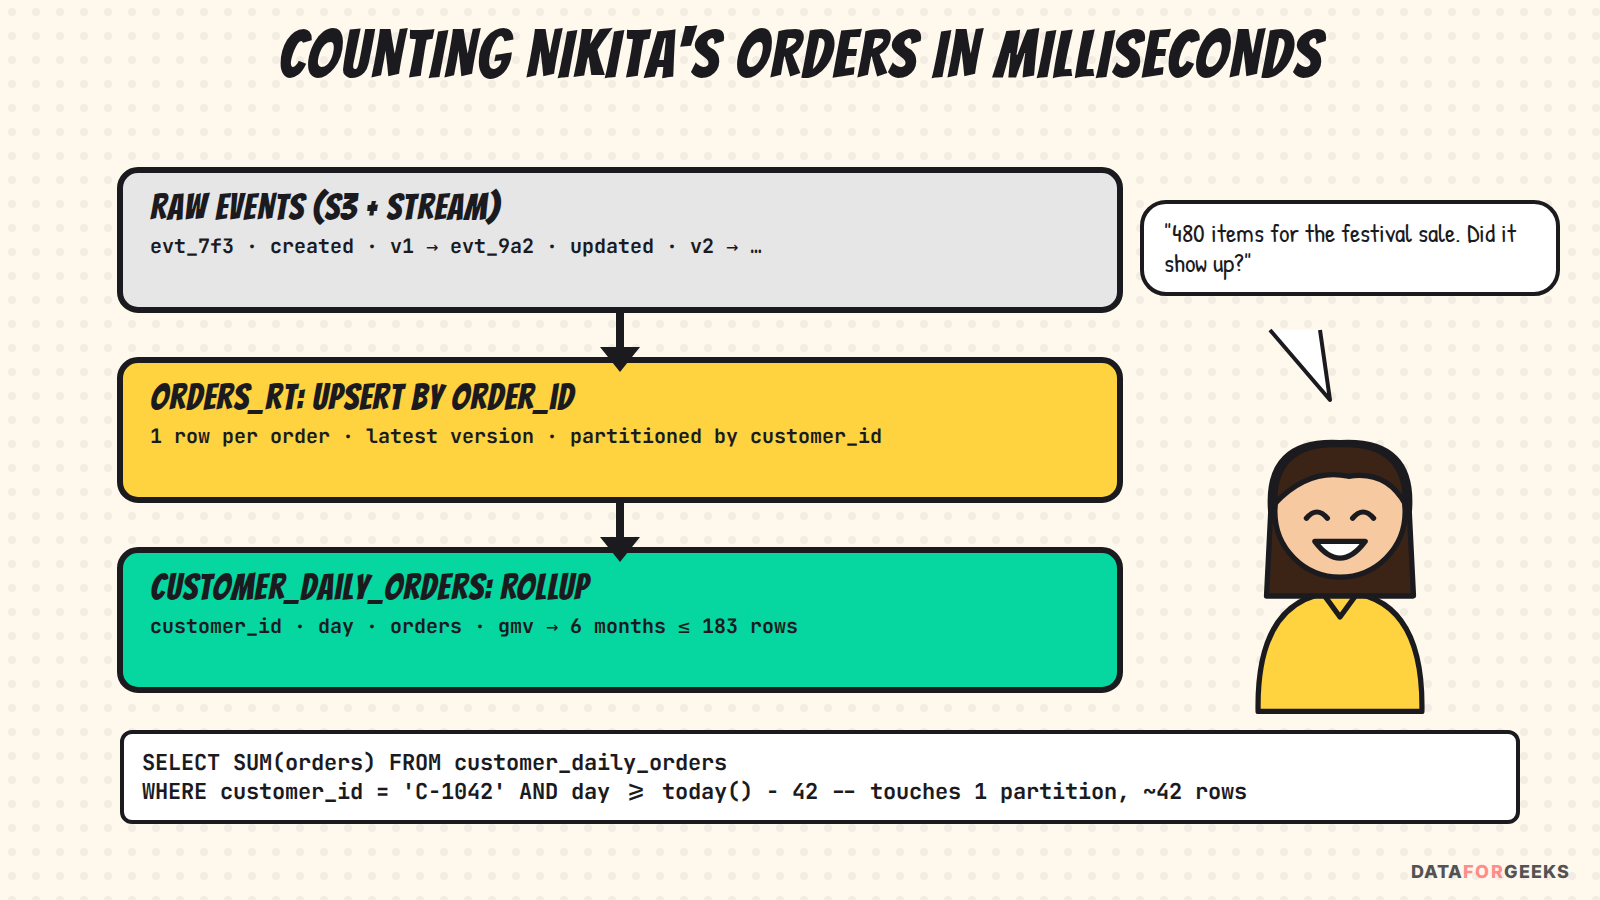
Nikita checks her order history on the app, and the support team checks it on the dashboard. Both are the same question: how many orders has customer C-1042 placed in the last 6 weeks? The model is built so that answering it reads a few dozen rows, not millions.
-- 1) Current state of every order (Pinot upsert table)
orders_rt(
  order_id      STRING  PRIMARY KEY,   -- upsert key
  customer_id   STRING,                -- stream partition key + sorted/inverted index
  version       LONG,                  -- comparison column: highest wins
  status        STRING,                -- CREATED | UPDATED | CANCELLED
  order_ts      TIMESTAMP,             -- event time (time column for pruning)
  total_amount  DOUBLE,
  item_count    INT,
  region        STRING,
  s3_uri        STRING                 -- claim-check pointer to full payload
)

-- 2) Pre-aggregated rollup (Flink output or materialized view)
customer_daily_orders(customer_id, day, orders, gmv, cancelled)   -- orders excludes cancellations
-- 6 months = at most ~183 rows per customer

-- 3) Minute metrics for the ops dashboard
metrics_minute(minute, region, orders, gmv, aov, cancellations)
-- "Orders by C-1042 in the last 6 weeks" → one partition, ~42 rows
SELECT SUM(orders) -- orders = active (non-cancelled) orders, kept correct by retract-and-add
FROM customer_daily_orders
WHERE customer_id = 'C-1042'
AND day >= CURRENT_DATE - INTERVAL '42' DAY;For history, the lakehouse keeps everything:
- Bronze: raw payloads in S3, exactly as received (replay source).
- Silver: Iceberg tables
orders(one row per order version) andorder_items(exploded line items), with PII tokenized. - Gold:
fact_orders,fact_order_items,dim_customerfor ad-hoc analysis in Athena or Snowflake. Iceberg tables in Snowflake can read the same files without copying them.
THE INTERVIEWER ASKS
“In Snowflake, would you index customer_id?”
What they’re really testing: Whether you know how the engine actually works, or reach for habits from row databases.
Strong answer: Standard Snowflake tables don’t have user-defined indexes; they use automatic micro-partition pruning. For fast point lookups you’d set a clustering key (e.g. (customer_id, order_date)) and/or enable the search optimization service. Only Hybrid Tables (Unistore) support traditional indexes, and they’re meant for transactional-style workloads. Knowing that difference is exactly what this question is checking.
THE INTERVIEWER ASKS
“An order is updated three times and then cancelled. Does the dashboard count it once?”
Strong answer: Yes. orders_rt keeps one row per order_id (latest version wins), so it counts once and shows as cancelled. The rollup applies differences: when an order changes, Flink subtracts the old contribution and adds the new one (a retract-and-add), so daily totals stay correct. Late or out-of-order versions are ignored by the version check.
THE INTERVIEWER ASKS
“One B2B customer places 2 million orders a month. Problems?”
Strong answer: A hot key: one stream partition and one Pinot partition carry that customer’s load. Options: give very large accounts their own partitioning (a salted sub-key like customer_id#bucket, merged at query time), rely on the rollup table for their lookups (still ~183 rows), and watch per-partition lag. Detect hot keys with metrics before customers notice.
Act V · Day 2
Chapter 9: Failures and replay
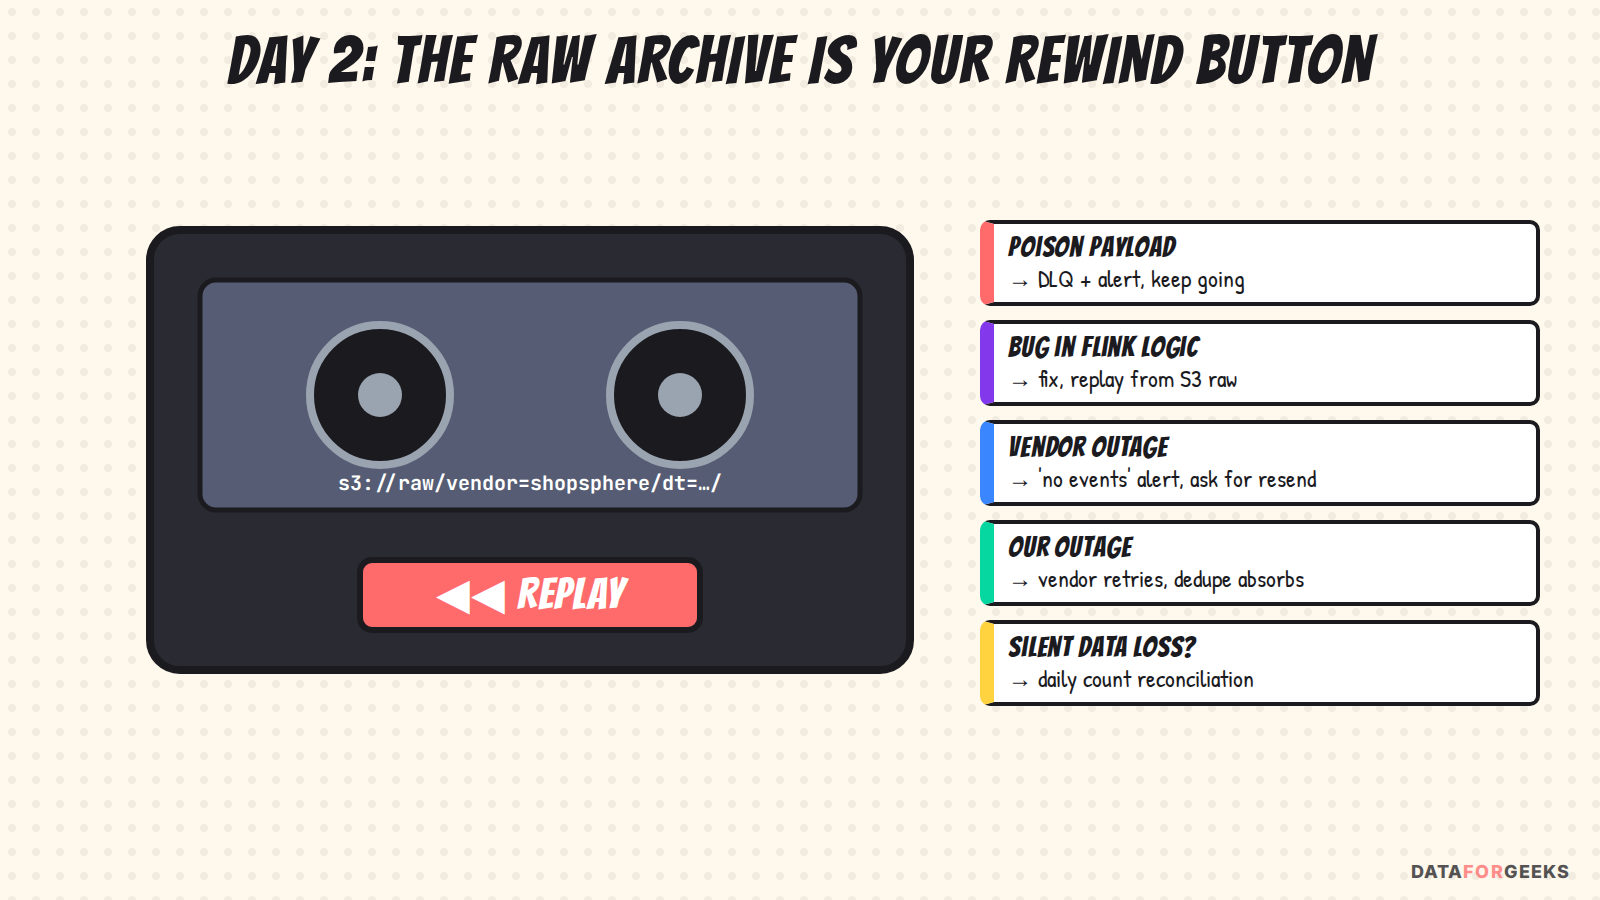
The raw archive in S3 is the design’s most valuable feature: it’s a rewind button. Because every payload is stored before we acknowledge it, any bug downstream can be fixed and replayed:
| What breaks | What happens | Recovery |
|---|---|---|
| Invalid or poison payload | Validation fails, or Flink throws on one record | Bounded retries → DLQ (with reason and S3 pointer) → alert → fix → replay; the partition keeps flowing |
| Bug in transformation logic | Wrong numbers on the dashboard | Fix, then reprocess from S3 raw (or from the stream if still within retention) into new Pinot segments; idempotent upserts make it safe |
| Flink job crash | Processing pauses | Restart from the last checkpoint; the stream holds the backlog; lag drains |
| Our endpoint down | Vendor gets 5xx | Vendor retries for 24 h; dedupe absorbs duplicates |
| Vendor down or silent | No events | “No events” alert by expected volume; ask for a time-range resend |
| Silent data loss | Nothing looks broken | Daily reconciliation: vendor counts vs our counts per hour |
| Region failure | Endpoint unreachable | Multi-AZ by default; for multi-region, a standby endpoint the vendor fails over to (DNS health checks), with S3 cross-region replication for raw data |
THE INTERVIEWER ASKS
“How do you replay three days of data without double-counting?”
Strong answer: Replays go through the same idempotent path. Pinot upserts by order_id with the version check, the rollups are rebuilt for the affected days (not incremented), and the lake uses Iceberg MERGE or overwrites the affected date partitions. Run the replay as a separate job with its own capacity, so live traffic keeps its 60-second budget. For recent problems you can also rewind the stream itself: Kinesis keeps data for 24 hours by default (extendable up to 365 days) and Kafka for as long as its retention is configured. S3 is the long-term source.
THE INTERVIEWER ASKS
“Day 0: the business wants two years of history on the dashboard from launch. How do you load it?”
Strong answer: Not through the real-time path; a two-year backfill would swamp it. Ask the vendor for a bulk export (files or a paged export API), land it in S3, and build the Iceberg tables and Pinot offline segments with a batch job (Spark or Flink batch). Then switch on the live feed from a cutover timestamp with a small overlap; dedupe by order_id + version makes the overlap harmless. Finally, reconcile counts per day between the backfill and the vendor’s totals.
THE INTERVIEWER ASKS
“The vendor adds, renames or removes a field without telling you. What happens?”
Strong answer: Added optional fields: ignored safely, because the raw payload keeps them and the schema can be extended later. Renamed or removed required fields: validation fails, events go to the DLQ (not silently dropped), and an alert fires on the schema-violation rate. Because raw payloads are in S3, once the mapping is fixed you replay the DLQ and nothing is lost. Long term: a written data contract with the vendor, a versioned payload (schema_version field), and a sandbox where they test changes against our validator first.
Chapter 10: Observability: proving the 60 seconds
“Under a minute” is a promise, so it needs a measurement, not a hope:
- End-to-end freshness SLI: for every event,
visible_in_pinot_ts − received_ts. Also send a synthetic canary event every 10 seconds through the whole path and alert if it doesn’t show up in time. Target: p95 < 60 s, alert at 45 s. Measure fromreceived_ts(our clock), not the vendor’sevent_ts: their clocks can be off, and delays before the data reaches us are outside our control (track those separately). - Per-stage metrics: requests, 2xx/4xx/5xx and auth failures by vendor; payload size p50/p99; S3 PUT latency; stream write throttles and consumer lag / iterator age; Flink backpressure and checkpoint duration; Pinot ingestion lag; dashboard query latency.
- Data quality: duplicate rate, schema-violation rate, null rates on key fields, events per minute vs the expected pattern for that time of day.
- Tracing: the
event_idtravels through every hop (headers, stream attributes, logs), so “where is event X?” is one search. - Alerting: page on symptoms (freshness SLO burn, “no events”, 5xx spike), not on CPU graphs. Every alert links to a runbook.
The alert catalogue
Interviewers often ask “what would you alert on?” A strong answer is a short list, each with a severity and a first action, not “we’d monitor everything”:
| Alert | Condition (example) | Severity | First action |
|---|---|---|---|
| Freshness SLO burning | p95 received→visible > 45 s for 5 min, or the canary is missing | Page | Find the stage that’s lagging: stream, Flink or Pinot |
| Vendor silence | Events/min < 20% of the expected value for this hour | Page (business hours) | Check the vendor’s status page, our 4xx/5xx, the endpoint’s health |
| Endpoint errors | 5xx > 1% for 5 min, or healthy tasks below minimum | Page | Roll back the last deploy, scale out, check dependencies |
| Stream backlog | Kinesis iterator age / Kafka consumer lag > 30 s | Page | Check Flink backpressure, scale parallelism |
| Flink unhealthy | Restarts > 3 in 10 min or checkpoint failures | Page | Look for poison messages (DLQ) and state size |
| Pinot ingestion lag | > 20 s behind the stream | Page | Check server CPU, consuming segments, replicas |
| Poller lag (pull) | Cursor lag > 60 s for 5 min | Page | Check vendor 429s and errors, worker health |
| DLQ growing | New DLQ messages in the last 15 min | Ticket | Inspect reasons; contact the vendor if it’s a schema change |
| Auth anomalies | Signature failures > 50/min, or requests from new sources | Ticket (page if sustained) | Check vendor config; follow the leaked-secret runbook if needed |
| Quota pressure (pull) | Vendor 429 rate > 20% | Ticket | Request a quota increase, rebalance slices |
| Expiry | Certificate or secret expires in < 30 days | Ticket | Rotate using the dual-key process |
| Reconciliation gap | Daily counts differ from the vendor’s by > 0.1% | Ticket | Re-fetch or ask for a resend of the affected hours |
| Cost anomaly | Daily spend > 1.5× the 7-day average | Ticket | Check S3 PUTs, shard count, runaway replays |
Dashboards to build: one for the platform (a panel per stage: endpoint or pollers → stream → Flink → Pinot, plus end-to-end freshness), one for data quality (duplicates, DLQ, schema violations, reconciliation) and one for cost. Every alert links to a runbook, and paging alerts are reviewed monthly so on-call stays sane.
THE INTERVIEWER ASKS
“The dashboard is fresh, but finance says yesterday’s order count is 2% lower. Who’s right?”
Strong answer: Check the usual causes: duplicates that weren’t removed (at-least-once delivery), cancellations counted differently, time-zone boundaries of “yesterday”, late events after the dashboard’s cut-off, and test orders. Then fix the definitions, not just the numbers: one shared metric definition (a semantic layer), with the lake as the reconciled source for finance and the real-time view labelled “provisional”.
Chapter 11: The data is personal
- Encrypt the raw bucket and stream with dedicated KMS keys, and allow only the ingest and replay roles to read raw payloads.
- Tokenize PII at the edge for the pointer events (e.g. email → token). Dashboards never need real emails.
- Retention: raw payloads for 30–90 days (enough to replay), tokenized silver data for 2 years.
- Erasure requests: delete by
customer_idin the lake (row-level deletes plus snapshot expiry), and let raw objects age out, or crypto-shred them (delete the per-customer key). - Audit: who read what, when, for every raw-data access.
Chapter 12: Cost and evolution
- Biggest cost drivers: S3 PUTs at peak (fixed by inline small events), stream capacity sized for a few peak days (switch to provisioned only around sales), and real-time OLAP servers (keep raw detail short in Pinot, roll up older data).
- Vendor #2: some vendors push and some only allow pull, so the ingestion layer is a set of connectors (a webhook receiver or a poller), each defined by per-vendor configuration: auth, schema mapping, quotas, cursors and partitioning. Each vendor’s payload maps to one canonical
ordermodel in Flink, so dashboards don’t care which vendor an order came from. - Testing and launch: contract tests against the vendor’s sample payloads, a load test replaying last year’s sale shape at 1.5×, a shadow run where the new pipeline processes live traffic without serving dashboards, and game days (kill a Flink job, throttle the stream, expire a certificate) before the first big sale.
- What Nikhil would simplify at small scale: for 100 events per second, skip claim-check and Pinot. Use API Gateway → Kinesis → Firehose → Snowflake with Snowpipe Streaming and a simple dashboard. Saying when not to use the full design is part of a strong answer.
Summary: the whole design on one page
If an interviewer asked you to summarize the whole design in two minutes, this is the page to have in your head. The diagram is the reference version, with every step numbered.
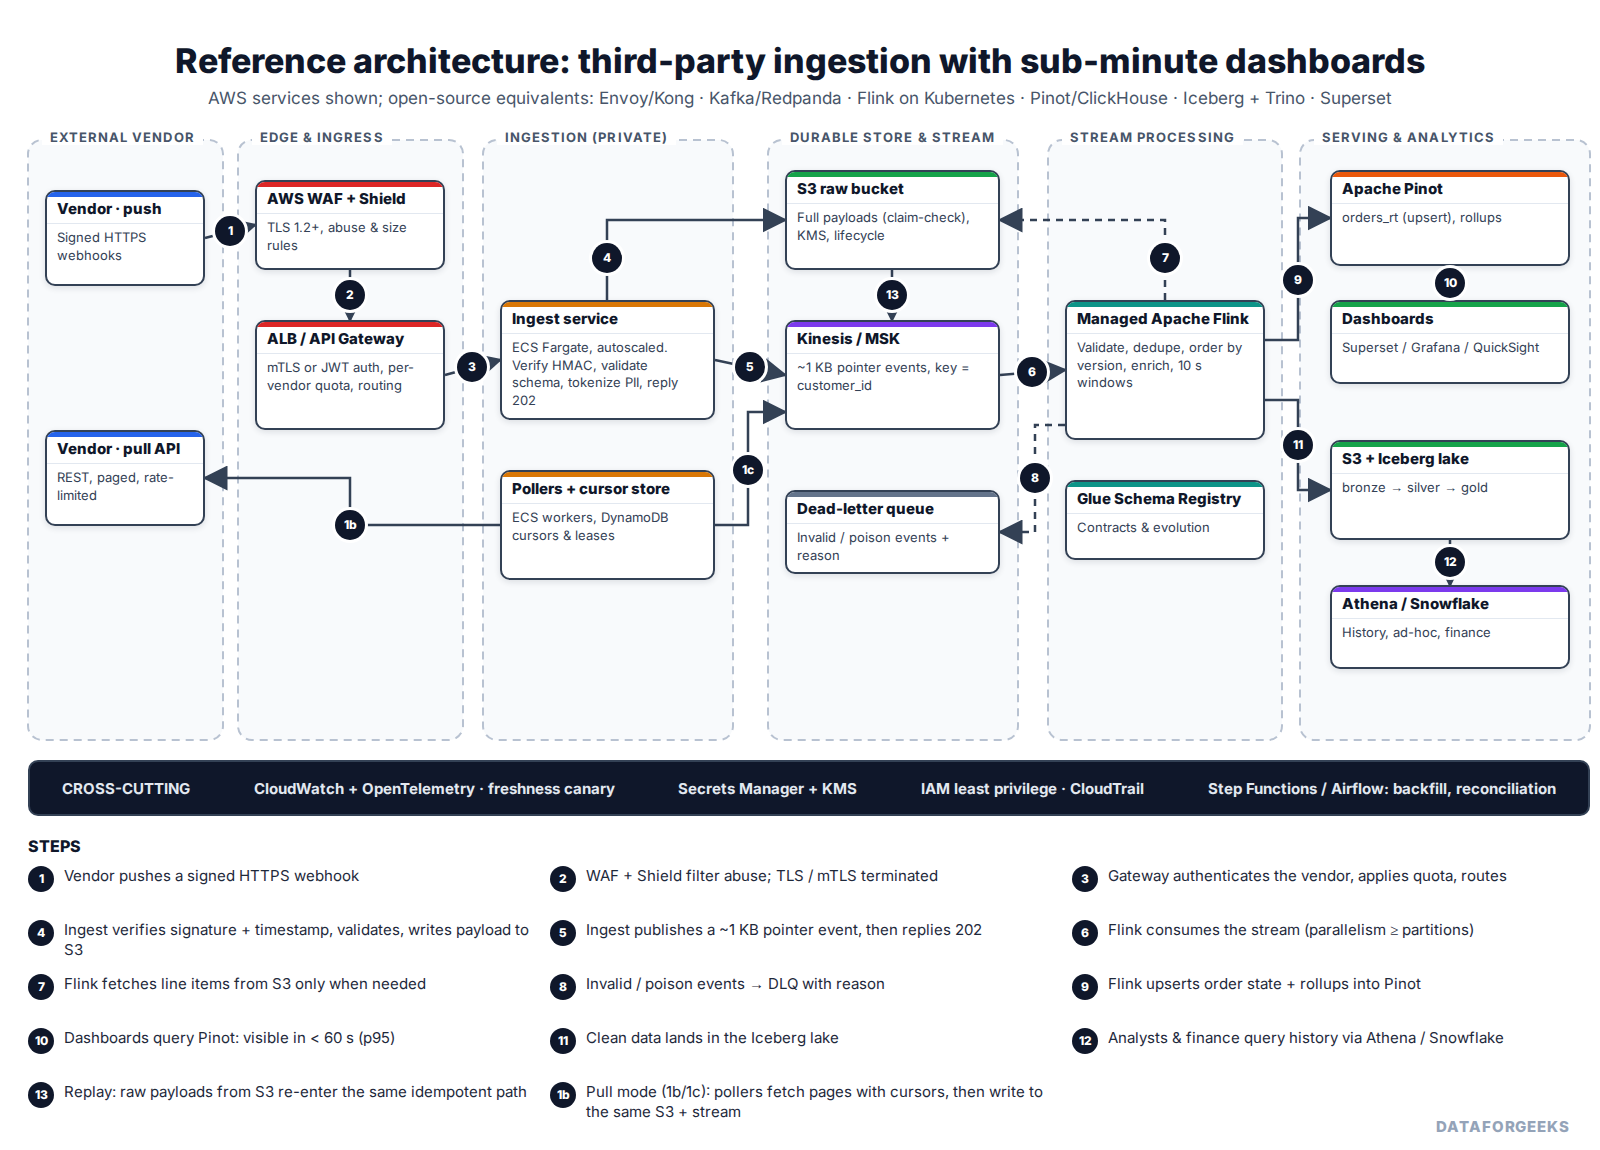
The two-minute version
“The vendor pushes signed webhooks to an endpoint behind WAF and an ALB with mTLS. A stateless ingest service verifies the signature and timestamp, validates the schema, stores the full payload in S3 and publishes a 1 KB pointer event keyed by customer to Kinesis, then replies 202. Flink dedupes by event ID, keeps the latest version of each order, enriches it and writes upserts and rollups to Pinot, which serves the dashboard in under 60 seconds at p95. The same data lands in an Iceberg lake for history and ad-hoc analysis. Failures go to a DLQ, and anything can be replayed from S3. If the vendor only supports pull, pollers with stored cursors feed the same S3 and stream, limited by their API quota. We measure freshness end to end, alert on silence, rotate secrets, and pre-scale before known sales.”
Requirement → decision
| Requirement or constraint | Decision | Chapter |
|---|---|---|
| Vendor is outside our network | HTTPS contract behind WAF + ALB/API Gateway; nothing internal exposed | Ch 1.1 |
| Must be sure it’s the vendor | mTLS / HMAC + timestamp / OAuth2; quotas; secrets rotation | Ch 2 |
| At-least-once delivery, no ordering | 202 after durable write; dedupe on event_id; highest version wins | Ch 3 |
| Vendor may only support pull | Long-running pollers, composite cursors, overlap window, same landing | Ch 1.2 |
| 1k → 60k events/s | Per-layer limits, pre-scaling, stream absorbs bursts, 429 is safe | Ch 4 |
| Payloads up to 5 MB | Claim-check to S3, compression, header/items split, raise limits last | Ch 5 |
| Dashboard < 60 s | Per-stage latency budget; Flink + Pinot; Snowflake for history | Ch 6–7 |
| Orders per customer, 6 weeks / 6 months | Upsert table + daily rollup, partitioned by customer_id | Ch 8 |
| Nothing lost, bugs fixable | Raw archive in S3, DLQ, replay, reconciliation, Day-0 bulk load | Ch 9 |
| Prove the 60 seconds | Freshness SLI from received_ts, canary events, burn-rate alerts | Ch 10 |
| PII in payloads | KMS, tokenization at the edge, least privilege, erasure path | Ch 11 |
| Cost and more vendors | Inline small events, sale-day capacity, connectors per vendor, start simple | Ch 12 |
Epilogue: How to run this round
The interviewer puts the pen down: “That’s the first time someone has worked out the 300 GB per second before I pointed it out.” The practice session moves on, and the whiteboard photo goes into Nikhil’s notes.
If you only remember one thing, remember the order:
- Clarify: push or pull (and design the door for whichever it is), delivery guarantee, ordering, rates, sizes, freshness, queries, PII, number of vendors, resend.
- Calculate: bytes per second at normal and peak load; the result decides the shape of the design.
- Sketch the main line: vendor → door → store + stream → process → serve → dashboard, with one reason per box.
- Secure the door: identity from certificates and signatures, not IPs; quotas; replay protection.
- Make it reliable: 202 after durable storage, idempotency, dedupe, version-based ordering.
- Handle the spike: layer-by-layer limits, pre-scaling, claim-check, compression, splitting.
- Spend the 60 seconds on purpose: a budget per stage, then the serving store and data model from the queries.
- Day 2: replay, DLQ, freshness SLI, reconciliation, PII, cost, vendor #2.
Common answers vs. strong answers
| Topic | Common answer | Strong answer |
|---|---|---|
| Opening | Lists tools in the first minute | Asks the questions that change the design, then does the math |
| Push vs pull | Assumes one and designs only for it | Designs the entry point for either; the pipeline after ingestion is shared; knows pull is capped by the vendor’s quota |
| Load balancer | “For regions / to spread traffic” | “The vendor needs an HTTPS contract. The LB only spreads requests over healthy ingest instances across AZs.” |
| Security | “We check the IP address” | mTLS or HMAC-signed requests + replay window; IP allowlist only as an extra layer |
| Spike | “Everything autoscales” | Names each layer’s limit; pre-scales for the calendar; 429 is safe because the vendor retries |
| 5 MB payloads | “Increase the message size” | Claim-check + compression + header/items split; raise limits last |
| Under 60 s | “Tool X is real-time” | A latency budget per stage, and a measured freshness SLI |
| Data model | “Index customer_id in the warehouse” | Upsert table partitioned by customer + daily rollup; knows how each engine actually does lookups |
| Commitment | Switches between tools when challenged | Picks one, explains the trade-off, names when the alternative would win |
Interview etiquette that matters more than it should
- If you don’t know a detail, say so and reason from first principles (“I don’t remember the exact limit; let’s assume ~1 MB and see what breaks”). Don’t search online during the interview.
- When challenged, engage with the challenge before defending (“That’s a fair point: IPs aren’t identity. Here’s what I’d use instead.”).
- Keep your own questions at the end about the team’s problems, roadmap and engineering culture, not about things you’ve heard informally.
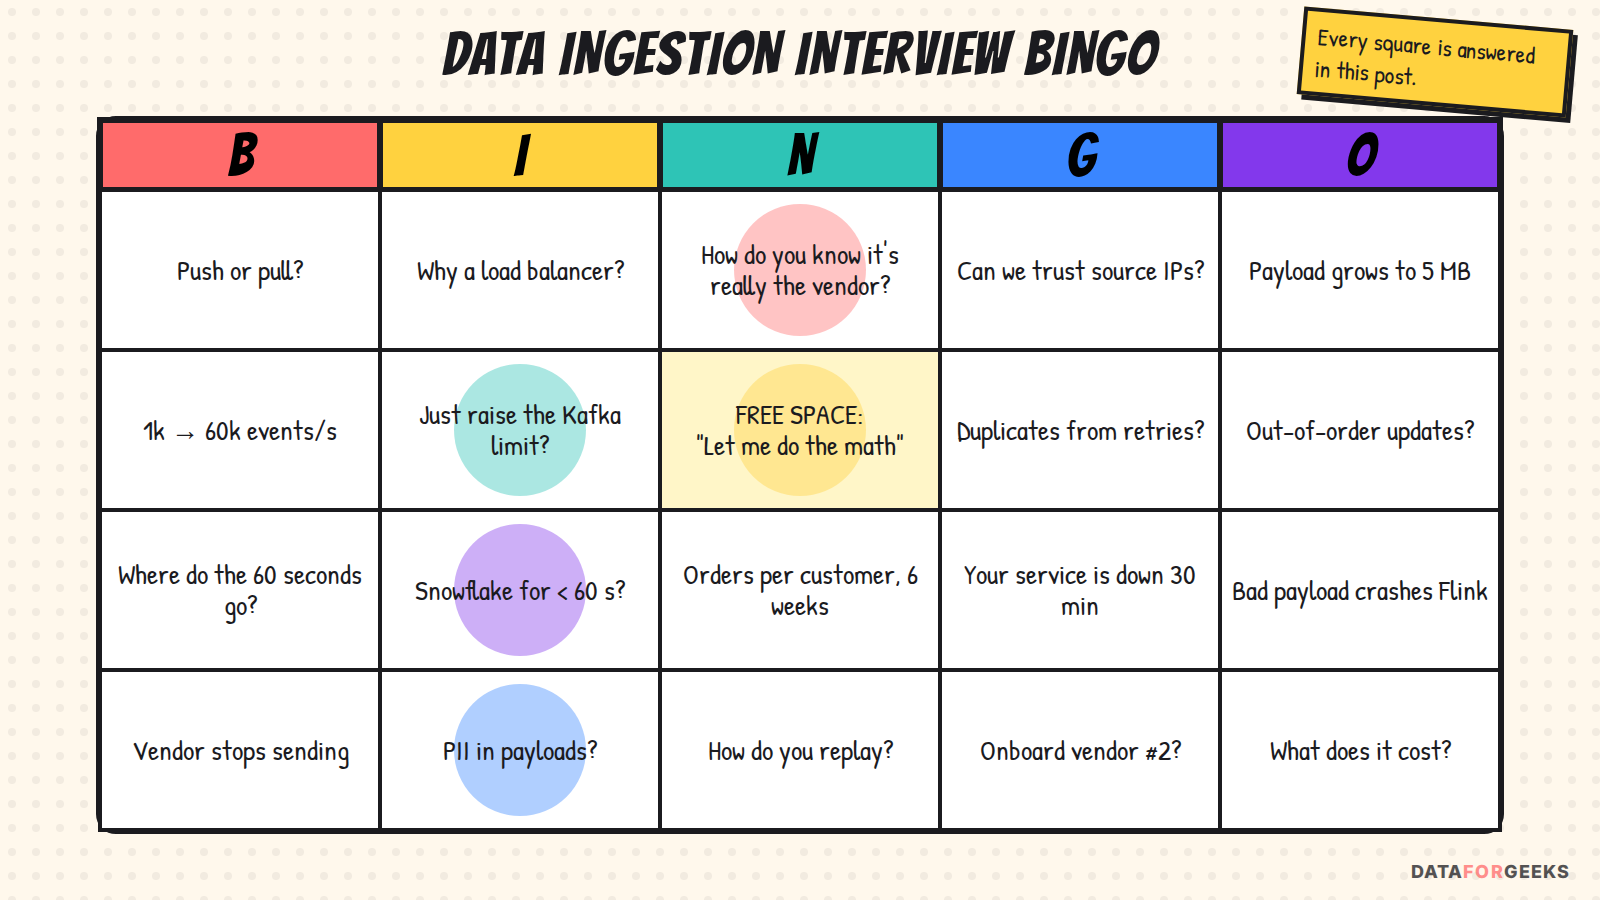
The cheat sheet
| If they ask… | Say this in one breath | Where |
|---|---|---|
| Push or pull? | Push → public secure endpoint, their retries are our buffer. Pull → pollers + cursors, their rate limit is our ceiling. Same pipeline after ingestion. | Ch 1 |
| Polling without missing records? | Composite cursor (updated_at, id), overlap window, save cursor after durable write, daily reconciliation | Ch 1.2 |
| API quota too low for 60 s? | Do the math, say it conflicts, offer quota increase / webhooks / relaxed freshness | Ch 1.2 |
| How much data? | 1 GB/s normal, 300 GB/s peak → move pointers, not payloads | Scene 3 |
| Why a load balancer? | HTTPS contract for an outside party; the LB spreads requests across healthy instances | Ch 1.1 |
| Why not write straight to Kafka? | Couples the vendor to our internals; no room for validation, PII handling or claim-check | Ch 1.1 |
| Is it really the vendor? | mTLS / HMAC + timestamp / OAuth2 client credentials; IPs only as an extra layer | Ch 2 |
| Retries and duplicates? | 202 after durable write; deterministic S3 keys; dedupe on (vendor, event_id) | Ch 3 |
| Out-of-order updates? | Highest version per order_id wins; partition by customer_id | Ch 3 |
| 60× spike? | Name each layer’s limit, pre-scale, let the stream absorb bursts, 429 is safe | Ch 4 |
| 5 MB payloads? | Claim-check, compression, header/items split, Avro/Protobuf, negotiate deltas | Ch 5 |
| Where do 60 s go? | Per-stage budget, ~31 s p95 with margin | Ch 6 |
| Snowflake for < 60 s? | Great for history; Dynamic Tables lag ≥ 1 min and cost at high QPS make it risky for the dashboard | Ch 6 |
| Serving store? | Pinot (upserts, streaming ingest, sub-second), ClickHouse as alternative | Ch 7 |
| Orders per customer? | Upsert table + daily rollup, partitioned by customer | Ch 8 |
| Replay? | From S3 raw through the same idempotent path, with separate capacity | Ch 9 |
| Prove freshness? | Per-event visible − received, synthetic canary, SLO alerts | Ch 10 |
| PII? | Encrypt, tokenize at the edge, limited raw retention, erasure path | Ch 11 |
| Cost? | Inline small events, provision for sale days only, roll up old data | Ch 12 |
Found this useful? Share it with someone preparing for a data engineering system design round, and subscribe to the DataForGeeks newsletter for the next walkthrough. Also read: One Ride, 400 Milliseconds: the ride-hailing system design and data model interview.